Immigrants from Cuba vs Crow Unemployment Among Ages 25 to 29 years
COMPARE
Immigrants from Cuba
Crow
Unemployment Among Ages 25 to 29 years
Unemployment Among Ages 25 to 29 years Comparison
Immigrants from Cuba
Crow
5.6%
UNEMPLOYMENT AMONG AGES 25 TO 29 YEARS
100.0/ 100
METRIC RATING
4th/ 347
METRIC RANK
15.4%
UNEMPLOYMENT AMONG AGES 25 TO 29 YEARS
0.0/ 100
METRIC RATING
346th/ 347
METRIC RANK
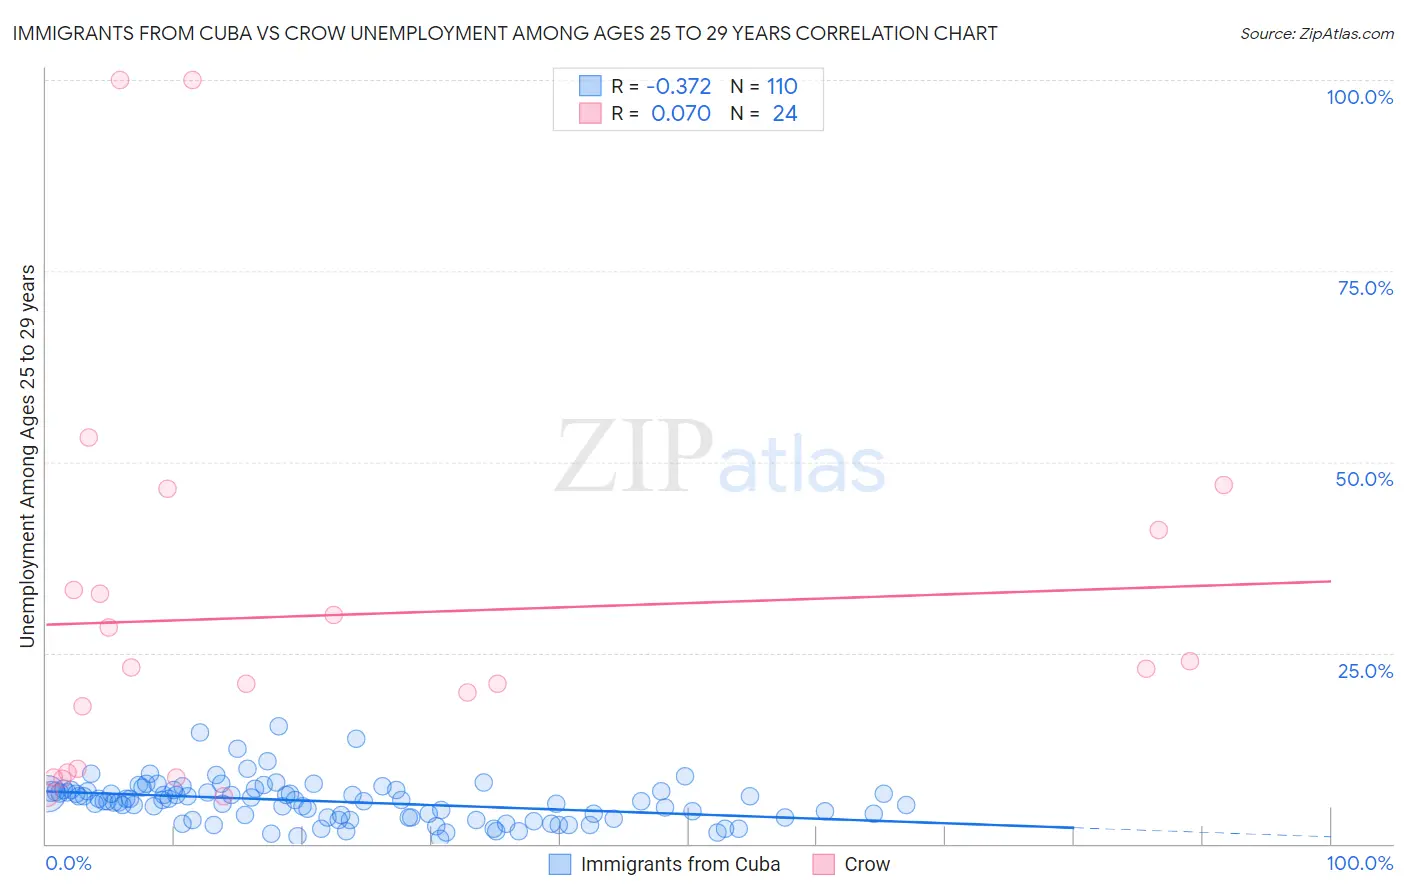
Immigrants from Cuba vs Crow Unemployment Among Ages 25 to 29 years Correlation Chart
The statistical analysis conducted on geographies consisting of 313,581,146 people shows a mild negative correlation between the proportion of Immigrants from Cuba and unemployment rate among population between the ages 25 and 29 in the United States with a correlation coefficient (R) of -0.372 and weighted average of 5.6%. Similarly, the statistical analysis conducted on geographies consisting of 58,166,191 people shows a slight positive correlation between the proportion of Crow and unemployment rate among population between the ages 25 and 29 in the United States with a correlation coefficient (R) of 0.070 and weighted average of 15.4%, a difference of 172.2%.
Unemployment Among Ages 25 to 29 years Correlation Summary
| Measurement | Immigrants from Cuba | Crow |
| Minimum | 0.70% | 6.3% |
| Maximum | 15.4% | 100.0% |
| Range | 14.7% | 93.7% |
| Mean | 5.5% | 30.0% |
| Median | 5.7% | 23.0% |
| Interquartile 25% (IQ1) | 3.5% | 9.5% |
| Interquartile 75% (IQ3) | 6.9% | 37.2% |
| Interquartile Range (IQR) | 3.4% | 27.7% |
| Standard Deviation (Sample) | 2.7% | 25.5% |
| Standard Deviation (Population) | 2.7% | 24.9% |
Similar Demographics by Unemployment Among Ages 25 to 29 years
Demographics Similar to Immigrants from Cuba by Unemployment Among Ages 25 to 29 years
In terms of unemployment among ages 25 to 29 years, the demographic groups most similar to Immigrants from Cuba are Somali (5.6%, a difference of 0.060%), Hmong (5.7%, a difference of 0.26%), Immigrants from India (5.7%, a difference of 0.34%), Immigrants from Bosnia and Herzegovina (5.7%, a difference of 0.45%), and Immigrants from Nepal (5.7%, a difference of 1.8%).
| Demographics | Rating | Rank | Unemployment Among Ages 25 to 29 years |
| Sudanese | 100.0 /100 | #1 | Exceptional 5.4% |
| Tongans | 100.0 /100 | #2 | Exceptional 5.5% |
| Immigrants | Somalia | 100.0 /100 | #3 | Exceptional 5.5% |
| Immigrants | Cuba | 100.0 /100 | #4 | Exceptional 5.6% |
| Somalis | 100.0 /100 | #5 | Exceptional 5.6% |
| Hmong | 100.0 /100 | #6 | Exceptional 5.7% |
| Immigrants | India | 100.0 /100 | #7 | Exceptional 5.7% |
| Immigrants | Bosnia and Herzegovina | 100.0 /100 | #8 | Exceptional 5.7% |
| Immigrants | Nepal | 100.0 /100 | #9 | Exceptional 5.7% |
| Immigrants | Sudan | 100.0 /100 | #10 | Exceptional 5.8% |
| Cambodians | 100.0 /100 | #11 | Exceptional 5.8% |
| Okinawans | 100.0 /100 | #12 | Exceptional 5.9% |
| Immigrants | Bolivia | 100.0 /100 | #13 | Exceptional 5.9% |
| Immigrants | Kuwait | 99.9 /100 | #14 | Exceptional 5.9% |
| Cubans | 99.9 /100 | #15 | Exceptional 5.9% |
Demographics Similar to Crow by Unemployment Among Ages 25 to 29 years
In terms of unemployment among ages 25 to 29 years, the demographic groups most similar to Crow are Arapaho (15.4%, a difference of 0.070%), Hopi (13.5%, a difference of 13.8%), Inupiat (13.4%, a difference of 14.5%), Yup'ik (17.9%, a difference of 16.6%), and Navajo (12.2%, a difference of 26.3%).
| Demographics | Rating | Rank | Unemployment Among Ages 25 to 29 years |
| Alaskan Athabascans | 0.0 /100 | #333 | Tragic 10.8% |
| Yuman | 0.0 /100 | #334 | Tragic 11.0% |
| Puerto Ricans | 0.0 /100 | #335 | Tragic 11.1% |
| Lumbee | 0.0 /100 | #336 | Tragic 11.2% |
| Menominee | 0.0 /100 | #337 | Tragic 11.3% |
| Sioux | 0.0 /100 | #338 | Tragic 11.7% |
| Pima | 0.0 /100 | #339 | Tragic 11.8% |
| Cheyenne | 0.0 /100 | #340 | Tragic 11.8% |
| Tohono O'odham | 0.0 /100 | #341 | Tragic 12.1% |
| Navajo | 0.0 /100 | #342 | Tragic 12.2% |
| Inupiat | 0.0 /100 | #343 | Tragic 13.4% |
| Hopi | 0.0 /100 | #344 | Tragic 13.5% |
| Arapaho | 0.0 /100 | #345 | Tragic 15.4% |
| Crow | 0.0 /100 | #346 | Tragic 15.4% |
| Yup'ik | 0.0 /100 | #347 | Tragic 17.9% |