Immigrants from Croatia vs Kenyan Unemployment Among Ages 25 to 29 years

COMPARE

Immigrants from Croatia
Race
Ancestry
AfghanAfricanAlaska NativeAlaskan AthabascanAlbanianAleutAlsatianAmericanApacheArabArapahoArgentineanArmenianAssyrian/Chaldean/SyriacAustralianAustrianBahamianBangladeshiBarbadianBasqueBelgianBelizeanBermudanBhutaneseBlackfeetBolivianBrazilianBritishBritish West IndianBulgarianBurmeseCajunCambodianCanadianCape VerdeanCarpatho RusynCelticCentral AmericanCentral American IndianCherokeeCheyenneChickasawChileanChineseChippewaChoctawColombianColvilleComancheCosta RicanCreeCreekCroatianCrowCubanCypriotCzechCzechoslovakianDanishDelawareDominicanDutchDutch West IndianEastern EuropeanEcuadorianEgyptianEnglishEstonianEthiopianEuropeanFijianFilipinoFinnishFrenchFrench American IndianFrench CanadianGermanGerman RussianGhanaianGreekGuamanian/ChamorroGuatemalanGuyaneseHaitianHmongHonduranHopiHoumaHungarianIcelanderIndian (Asian)IndonesianInupiatIranianIraqiIrishIroquoisIsraeliItalianJamaicanJapaneseJordanianKiowaKoreanLaotianLatvianLebaneseLiberianLithuanianLumbeeLuxembourgerMacedonianMalaysianMalteseMarshalleseMenomineeMexicanMexican American IndianMongolianMoroccanNative HawaiianNavajoNepaleseNew ZealanderNicaraguanNigerianNorthern EuropeanNorwegianOkinawanOsageOttawaPaiutePakistaniPalestinianPanamanianParaguayanPennsylvania GermanPeruvianPimaPolishPortuguesePotawatomiPuebloPuerto RicanPuget Sound SalishRomanianRussianSalvadoranSamoanScandinavianScotch-IrishScottishSeminoleSenegaleseSerbianShoshoneSierra LeoneanSiouxSlavicSlovakSloveneSomaliSouth AfricanSouth AmericanSouth American IndianSoviet UnionSpaniardSpanishSpanish AmericanSpanish American IndianSri LankanSubsaharan AfricanSudaneseSwedishSwissSyrianTaiwaneseThaiTlingit-HaidaTohono O'OdhamTonganTrinidadian and TobagonianTsimshianTurkishU.S. Virgin IslanderUgandanUkrainianUruguayanUteVenezuelanVietnameseWelshWest IndianYakamaYaquiYugoslavianYumanYup'ikZimbabwean
Immigration
NonimmigrantsImmigrantsAfghanistanAfricaAlbaniaArgentinaArmeniaAsiaAustraliaAustriaBahamasBangladeshBarbadosBelarusBelgiumBelizeBoliviaBosnia and HerzegovinaBrazilBulgariaBurma/MyanmarCabo VerdeCambodiaCameroonCanadaCaribbeanCentral AmericaChileChinaColombiaCongoCosta RicaCroatiaCubaCzechoslovakiaDenmarkDominicaDominican RepublicEastern AfricaEastern AsiaEastern EuropeEcuadorEgyptEl SalvadorEnglandEritreaEthiopiaEuropeFijiFranceGermanyGhanaGreeceGrenadaGuatemalaGuyanaHaitiHondurasHong KongHungaryIndiaIndonesiaIranIraqIrelandIsraelItalyJamaicaJapanJordanKazakhstanKenyaKoreaKuwaitLaosLatin AmericaLatviaLebanonLiberiaLithuaniaMalaysiaMexicoMicronesiaMiddle AfricaMoldovaMoroccoNepalNetherlandsNicaraguaNigeriaNorth AmericaNorth MacedoniaNorthern AfricaNorthern EuropeNorwayOceaniaPakistanPanamaPeruPhilippinesPolandPortugalRomaniaRussiaSaudi ArabiaScotlandSenegalSerbiaSierra LeoneSingaporeSomaliaSouth AfricaSouth AmericaSouth Central AsiaSouth Eastern AsiaSouthern EuropeSpainSri LankaSt. Vincent and the GrenadinesSudanSwedenSwitzerlandSyriaTaiwanThailandTrinidad and TobagoTurkeyUgandaUkraineUruguayUzbekistanVenezuelaVietnamWest IndiesWestern AfricaWestern AsiaWestern EuropeYemenZaireZimbabweAzores
Kenyan
Race
Ancestry
AfghanAfricanAlaska NativeAlaskan AthabascanAlbanianAleutAlsatianAmericanApacheArabArapahoArgentineanArmenianAssyrian/Chaldean/SyriacAustralianAustrianBahamianBangladeshiBarbadianBasqueBelgianBelizeanBermudanBhutaneseBlackfeetBolivianBrazilianBritishBritish West IndianBulgarianBurmeseCajunCambodianCanadianCape VerdeanCarpatho RusynCelticCentral AmericanCentral American IndianCherokeeCheyenneChickasawChileanChineseChippewaChoctawColombianColvilleComancheCosta RicanCreeCreekCroatianCrowCubanCypriotCzechCzechoslovakianDanishDelawareDominicanDutchDutch West IndianEastern EuropeanEcuadorianEgyptianEnglishEstonianEthiopianEuropeanFijianFilipinoFinnishFrenchFrench American IndianFrench CanadianGermanGerman RussianGhanaianGreekGuamanian/ChamorroGuatemalanGuyaneseHaitianHmongHonduranHopiHoumaHungarianIcelanderIndian (Asian)IndonesianInupiatIranianIraqiIrishIroquoisIsraeliItalianJamaicanJapaneseJordanianKenyanKiowaKoreanLaotianLatvianLebaneseLiberianLithuanianLumbeeLuxembourgerMacedonianMalaysianMalteseMarshalleseMenomineeMexicanMexican American IndianMongolianMoroccanNative HawaiianNavajoNepaleseNew ZealanderNicaraguanNigerianNorthern EuropeanNorwegianOkinawanOsageOttawaPaiutePakistaniPalestinianPanamanianParaguayanPennsylvania GermanPeruvianPimaPolishPortuguesePotawatomiPuebloPuerto RicanPuget Sound SalishRomanianRussianSalvadoranSamoanScandinavianScotch-IrishScottishSeminoleSenegaleseSerbianShoshoneSierra LeoneanSiouxSlavicSlovakSloveneSomaliSouth AfricanSouth AmericanSouth American IndianSoviet UnionSpaniardSpanishSpanish AmericanSpanish American IndianSri LankanSubsaharan AfricanSudaneseSwedishSwissSyrianTaiwaneseThaiTlingit-HaidaTohono O'OdhamTonganTrinidadian and TobagonianTsimshianTurkishU.S. Virgin IslanderUgandanUkrainianUruguayanUteVenezuelanVietnameseWelshWest IndianYakamaYaquiYugoslavianYumanYup'ikZimbabwean
Immigration
NonimmigrantsImmigrantsAfghanistanAfricaAlbaniaArgentinaArmeniaAsiaAustraliaAustriaBahamasBangladeshBarbadosBelarusBelgiumBelizeBoliviaBosnia and HerzegovinaBrazilBulgariaBurma/MyanmarCabo VerdeCambodiaCameroonCanadaCaribbeanCentral AmericaChileChinaColombiaCongoCosta RicaCubaCzechoslovakiaDenmarkDominicaDominican RepublicEastern AfricaEastern AsiaEastern EuropeEcuadorEgyptEl SalvadorEnglandEritreaEthiopiaEuropeFijiFranceGermanyGhanaGreeceGrenadaGuatemalaGuyanaHaitiHondurasHong KongHungaryIndiaIndonesiaIranIraqIrelandIsraelItalyJamaicaJapanJordanKazakhstanKenyaKoreaKuwaitLaosLatin AmericaLatviaLebanonLiberiaLithuaniaMalaysiaMexicoMicronesiaMiddle AfricaMoldovaMoroccoNepalNetherlandsNicaraguaNigeriaNorth AmericaNorth MacedoniaNorthern AfricaNorthern EuropeNorwayOceaniaPakistanPanamaPeruPhilippinesPolandPortugalRomaniaRussiaSaudi ArabiaScotlandSenegalSerbiaSierra LeoneSingaporeSomaliaSouth AfricaSouth AmericaSouth Central AsiaSouth Eastern AsiaSouthern EuropeSpainSri LankaSt. Vincent and the GrenadinesSudanSwedenSwitzerlandSyriaTaiwanThailandTrinidad and TobagoTurkeyUgandaUkraineUruguayUzbekistanVenezuelaVietnamWest IndiesWestern AfricaWestern AsiaWestern EuropeYemenZaireZimbabweAzores
Unemployment Among Ages 25 to 29 years
Income
Poverty
Unemployment
Labor Participation
Family Structure
Vehicle Availability
Education Level
Disability

Unemployment Among Ages 25 to 29 years Comparison

Immigrants from Croatia

Kenyans

Good
Exceptional
6.5%
UNEMPLOYMENT AMONG AGES 25 TO 29 YEARS
75.5/ 100
METRIC RATING
135th/ 347
METRIC RANK
6.3%
UNEMPLOYMENT AMONG AGES 25 TO 29 YEARS
98.0/ 100
METRIC RATING
63rd/ 347
METRIC RANK

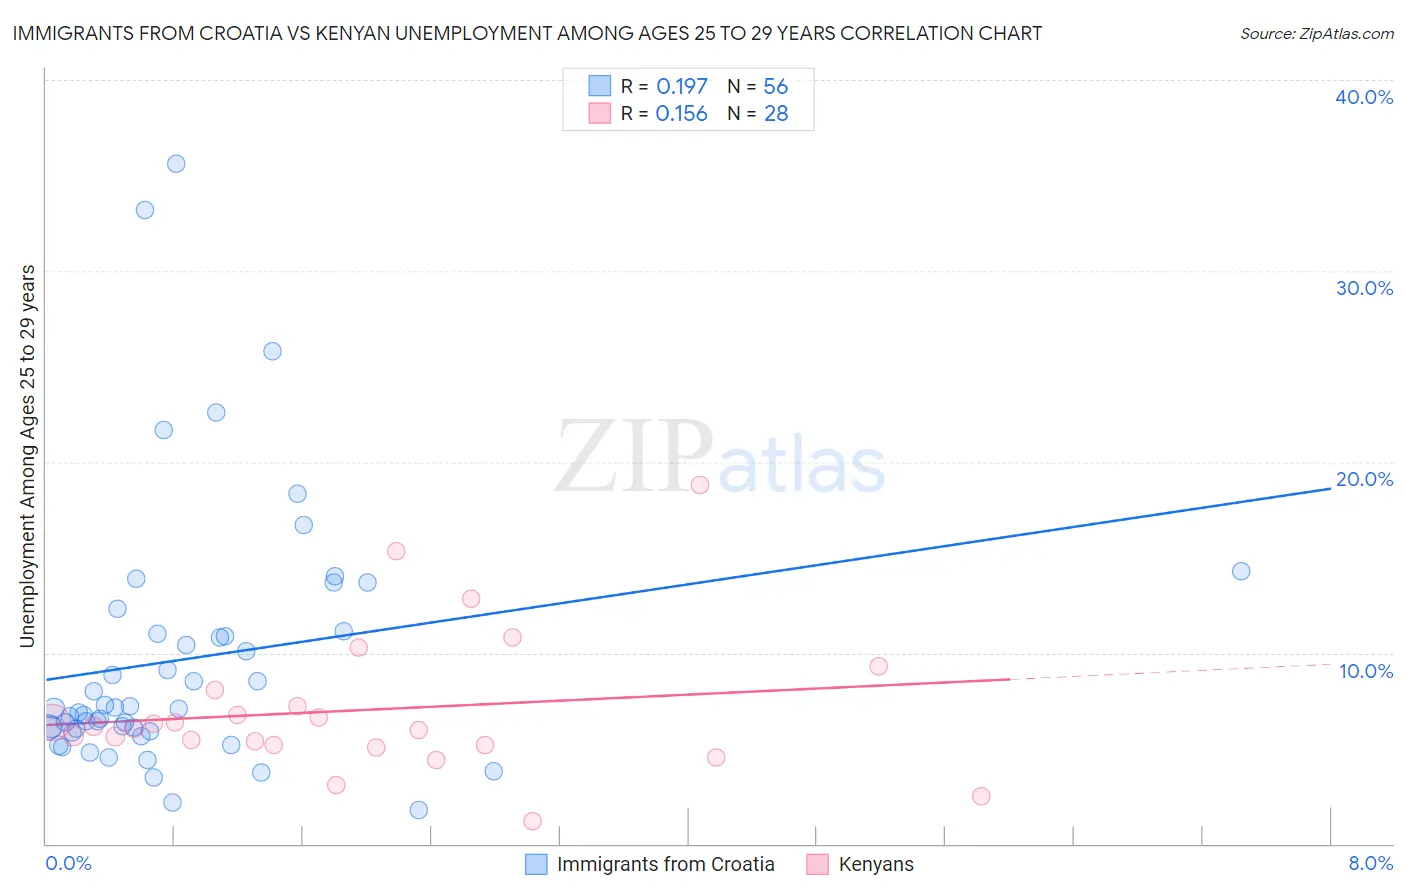
Immigrants from Croatia vs Kenyan Unemployment Among Ages 25 to 29 years Correlation Chart

The statistical analysis conducted on geographies consisting of 129,972,680 people shows a poor positive correlation between the proportion of Immigrants from Croatia and unemployment rate among population between the ages 25 and 29 in the United States with a correlation coefficient (R) of 0.197 and weighted average of 6.5%. Similarly, the statistical analysis conducted on geographies consisting of 165,555,949 people shows a poor positive correlation between the proportion of Kenyans and unemployment rate among population between the ages 25 and 29 in the United States with a correlation coefficient (R) of 0.156 and weighted average of 6.3%, a difference of 4.5%.
Immigrants from Croatia vs Kenyan Unemployment Among Ages 25 to 29 years

Unemployment Among Ages 25 to 29 years Correlation Summary

MeasurementImmigrants from CroatiaKenyan
Minimum1.8%1.2%
Maximum35.6%18.8%
Range33.8%17.6%
Mean9.7%7.0%
Median7.1%6.1%
Interquartile 25% (IQ1)6.0%5.2%
Interquartile 75% (IQ3)11.1%7.6%
Interquartile Range (IQR)5.1%2.4%
Standard Deviation (Sample)6.9%3.8%
Standard Deviation (Population)6.8%3.7%

Similar Demographics by Unemployment Among Ages 25 to 29 years

Demographics Similar to Immigrants from Croatia by Unemployment Among Ages 25 to 29 years

In terms of unemployment among ages 25 to 29 years, the demographic groups most similar to Immigrants from Croatia are Immigrants from Europe (6.5%, a difference of 0.010%), Immigrants from Vietnam (6.5%, a difference of 0.010%), Northern European (6.5%, a difference of 0.010%), Polish (6.5%, a difference of 0.090%), and Eastern European (6.5%, a difference of 0.12%).
DemographicsRating | RankUnemployment Among Ages 25 to 29 years
Immigrants | Chile
80.5
/100
|
#128
Excellent
6.5%
Sri Lankans
80.3
/100
|
#129
Excellent
6.5%
Immigrants | Peru
79.9
/100
|
#130
Good
6.5%
Immigrants | Afghanistan
79.2
/100
|
#131
Good
6.5%
Poles
76.6
/100
|
#132
Good
6.5%
Immigrants | Europe
75.7
/100
|
#133
Good
6.5%
Immigrants | Vietnam
75.6
/100
|
#134
Good
6.5%
Immigrants | Croatia
75.5
/100
|
#135
Good
6.5%
Northern Europeans
75.4
/100
|
#136
Good
6.5%
Eastern Europeans
74.1
/100
|
#137
Good
6.5%
Immigrants | Belgium
73.8
/100
|
#138
Good
6.5%
Austrians
73.8
/100
|
#139
Good
6.5%
Immigrants | Pakistan
73.8
/100
|
#140
Good
6.5%
Maltese
72.9
/100
|
#141
Good
6.5%
Slavs
72.5
/100
|
#142
Good
6.5%

Demographics Similar to Kenyans by Unemployment Among Ages 25 to 29 years

In terms of unemployment among ages 25 to 29 years, the demographic groups most similar to Kenyans are Immigrants from Sri Lanka (6.3%, a difference of 0.050%), Immigrants from China (6.2%, a difference of 0.070%), Immigrants from Lebanon (6.3%, a difference of 0.10%), Indian (Asian) (6.3%, a difference of 0.12%), and Immigrants from Northern Africa (6.3%, a difference of 0.13%).
DemographicsRating | RankUnemployment Among Ages 25 to 29 years
Immigrants | Burma/Myanmar
98.7
/100
|
#56
Exceptional
6.2%
Immigrants | Saudi Arabia
98.6
/100
|
#57
Exceptional
6.2%
Immigrants | Eastern Asia
98.4
/100
|
#58
Exceptional
6.2%
Luxembourgers
98.3
/100
|
#59
Exceptional
6.2%
Immigrants | Taiwan
98.3
/100
|
#60
Exceptional
6.2%
Bhutanese
98.2
/100
|
#61
Exceptional
6.2%
Immigrants | China
98.1
/100
|
#62
Exceptional
6.2%
Kenyans
98.0
/100
|
#63
Exceptional
6.3%
Immigrants | Sri Lanka
97.9
/100
|
#64
Exceptional
6.3%
Immigrants | Lebanon
97.8
/100
|
#65
Exceptional
6.3%
Indians (Asian)
97.8
/100
|
#66
Exceptional
6.3%
Immigrants | Northern Africa
97.8
/100
|
#67
Exceptional
6.3%
Palestinians
97.7
/100
|
#68
Exceptional
6.3%
Immigrants | Hong Kong
97.5
/100
|
#69
Exceptional
6.3%
Immigrants | Malaysia
97.5
/100
|
#70
Exceptional
6.3%