Immigrants from Croatia vs American Unemployment Among Women with Children Under 6 years
COMPARE
Immigrants from Croatia
American
Unemployment Among Women with Children Under 6 years
Unemployment Among Women with Children Under 6 years Comparison
Immigrants from Croatia
Americans
7.1%
UNEMPLOYMENT AMONG WOMEN WITH CHILDREN UNDER 6 YEARS
98.9/ 100
METRIC RATING
77th/ 347
METRIC RANK
9.3%
UNEMPLOYMENT AMONG WOMEN WITH CHILDREN UNDER 6 YEARS
0.0/ 100
METRIC RATING
313th/ 347
METRIC RANK
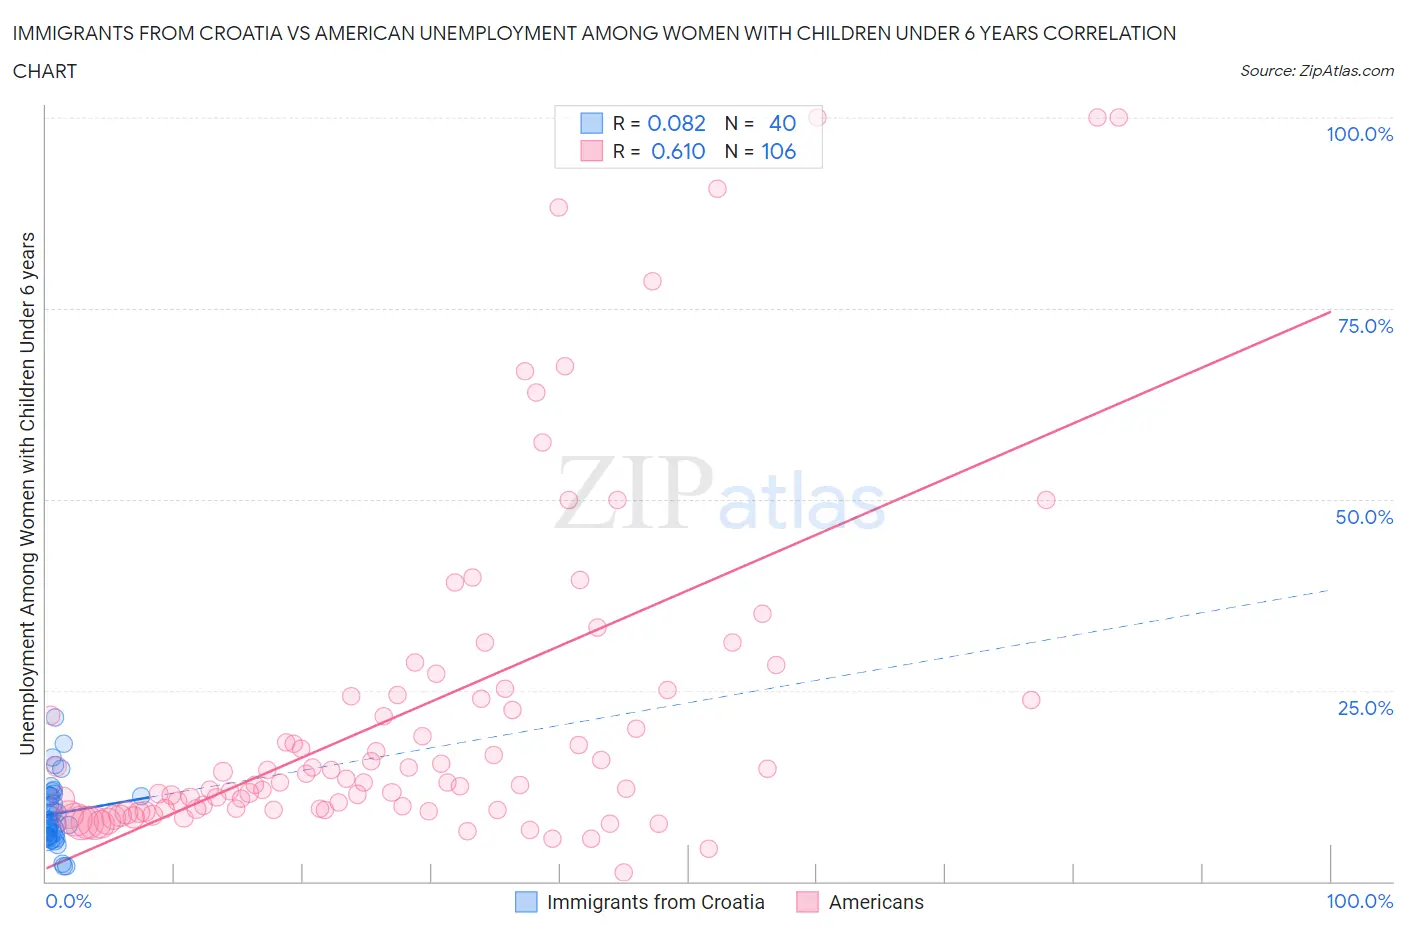
Immigrants from Croatia vs American Unemployment Among Women with Children Under 6 years Correlation Chart
The statistical analysis conducted on geographies consisting of 114,346,800 people shows a slight positive correlation between the proportion of Immigrants from Croatia and unemployment rate among women with children under the age of 6 in the United States with a correlation coefficient (R) of 0.082 and weighted average of 7.1%. Similarly, the statistical analysis conducted on geographies consisting of 380,925,631 people shows a significant positive correlation between the proportion of Americans and unemployment rate among women with children under the age of 6 in the United States with a correlation coefficient (R) of 0.610 and weighted average of 9.3%, a difference of 30.8%.
Unemployment Among Women with Children Under 6 years Correlation Summary
| Measurement | Immigrants from Croatia | American |
| Minimum | 1.9% | 1.1% |
| Maximum | 21.4% | 100.0% |
| Range | 19.5% | 98.9% |
| Mean | 8.8% | 22.1% |
| Median | 7.6% | 12.9% |
| Interquartile 25% (IQ1) | 6.1% | 9.4% |
| Interquartile 75% (IQ3) | 11.2% | 24.2% |
| Interquartile Range (IQR) | 5.1% | 14.8% |
| Standard Deviation (Sample) | 4.2% | 22.1% |
| Standard Deviation (Population) | 4.2% | 21.9% |
Similar Demographics by Unemployment Among Women with Children Under 6 years
Demographics Similar to Immigrants from Croatia by Unemployment Among Women with Children Under 6 years
In terms of unemployment among women with children under 6 years, the demographic groups most similar to Immigrants from Croatia are Estonian (7.1%, a difference of 0.030%), Immigrants from Somalia (7.1%, a difference of 0.040%), Immigrants from Eastern Europe (7.1%, a difference of 0.080%), Immigrants from Fiji (7.1%, a difference of 0.090%), and Immigrants from Greece (7.1%, a difference of 0.11%).
| Demographics | Rating | Rank | Unemployment Among Women with Children Under 6 years |
| Immigrants | Iraq | 99.4 /100 | #70 | Exceptional 7.0% |
| Afghans | 99.4 /100 | #71 | Exceptional 7.0% |
| Cubans | 99.4 /100 | #72 | Exceptional 7.0% |
| Immigrants | Czechoslovakia | 99.2 /100 | #73 | Exceptional 7.0% |
| Turks | 99.2 /100 | #74 | Exceptional 7.0% |
| Immigrants | Eastern Europe | 99.0 /100 | #75 | Exceptional 7.1% |
| Estonians | 99.0 /100 | #76 | Exceptional 7.1% |
| Immigrants | Croatia | 98.9 /100 | #77 | Exceptional 7.1% |
| Immigrants | Somalia | 98.9 /100 | #78 | Exceptional 7.1% |
| Immigrants | Fiji | 98.9 /100 | #79 | Exceptional 7.1% |
| Immigrants | Greece | 98.9 /100 | #80 | Exceptional 7.1% |
| Immigrants | Venezuela | 98.8 /100 | #81 | Exceptional 7.1% |
| Immigrants | Afghanistan | 98.7 /100 | #82 | Exceptional 7.1% |
| Egyptians | 98.7 /100 | #83 | Exceptional 7.1% |
| Immigrants | Albania | 98.7 /100 | #84 | Exceptional 7.1% |
Demographics Similar to Americans by Unemployment Among Women with Children Under 6 years
In terms of unemployment among women with children under 6 years, the demographic groups most similar to Americans are Fijian (9.3%, a difference of 0.030%), Immigrants from the Azores (9.2%, a difference of 0.44%), French American Indian (9.2%, a difference of 0.58%), Cherokee (9.3%, a difference of 0.80%), and Cajun (9.2%, a difference of 0.86%).
| Demographics | Rating | Rank | Unemployment Among Women with Children Under 6 years |
| Pueblo | 0.0 /100 | #306 | Tragic 9.1% |
| Dominicans | 0.0 /100 | #307 | Tragic 9.1% |
| Immigrants | Micronesia | 0.0 /100 | #308 | Tragic 9.1% |
| Africans | 0.0 /100 | #309 | Tragic 9.2% |
| Cajuns | 0.0 /100 | #310 | Tragic 9.2% |
| French American Indians | 0.0 /100 | #311 | Tragic 9.2% |
| Immigrants | Azores | 0.0 /100 | #312 | Tragic 9.2% |
| Americans | 0.0 /100 | #313 | Tragic 9.3% |
| Fijians | 0.0 /100 | #314 | Tragic 9.3% |
| Cherokee | 0.0 /100 | #315 | Tragic 9.3% |
| Houma | 0.0 /100 | #316 | Tragic 9.4% |
| Dutch West Indians | 0.0 /100 | #317 | Tragic 9.5% |
| Osage | 0.0 /100 | #318 | Tragic 9.5% |
| Marshallese | 0.0 /100 | #319 | Tragic 9.6% |
| Potawatomi | 0.0 /100 | #320 | Tragic 9.6% |