Immigrants from Congo vs Okinawan Unemployment Among Ages 45 to 54 years

COMPARE

Immigrants from Congo
Race
Ancestry
AfghanAfricanAlaska NativeAlaskan AthabascanAlbanianAleutAlsatianAmericanApacheArabArapahoArgentineanArmenianAssyrian/Chaldean/SyriacAustralianAustrianBahamianBangladeshiBarbadianBasqueBelgianBelizeanBermudanBhutaneseBlackfeetBolivianBrazilianBritishBritish West IndianBulgarianBurmeseCajunCambodianCanadianCape VerdeanCarpatho RusynCelticCentral AmericanCentral American IndianCherokeeCheyenneChickasawChileanChineseChippewaChoctawColombianColvilleComancheCosta RicanCreeCreekCroatianCrowCubanCypriotCzechCzechoslovakianDanishDelawareDominicanDutchDutch West IndianEastern EuropeanEcuadorianEgyptianEnglishEstonianEthiopianEuropeanFijianFilipinoFinnishFrenchFrench American IndianFrench CanadianGermanGerman RussianGhanaianGreekGuamanian/ChamorroGuatemalanGuyaneseHaitianHmongHonduranHopiHoumaHungarianIcelanderIndian (Asian)IndonesianInupiatIranianIraqiIrishIroquoisIsraeliItalianJamaicanJapaneseJordanianKenyanKiowaKoreanLaotianLatvianLebaneseLiberianLithuanianLumbeeLuxembourgerMacedonianMalaysianMalteseMarshalleseMenomineeMexicanMexican American IndianMongolianMoroccanNative HawaiianNavajoNepaleseNew ZealanderNicaraguanNigerianNorthern EuropeanNorwegianOsageOttawaPaiutePakistaniPalestinianPanamanianParaguayanPennsylvania GermanPeruvianPimaPolishPortuguesePotawatomiPuebloPuerto RicanPuget Sound SalishRomanianRussianSalvadoranSamoanScandinavianScotch-IrishScottishSeminoleSenegaleseSerbianShoshoneSierra LeoneanSiouxSlavicSlovakSloveneSomaliSouth AfricanSouth AmericanSouth American IndianSoviet UnionSpaniardSpanishSpanish AmericanSpanish American IndianSri LankanSubsaharan AfricanSudaneseSwedishSwissSyrianTaiwaneseThaiTlingit-HaidaTohono O'OdhamTonganTrinidadian and TobagonianTsimshianTurkishU.S. Virgin IslanderUgandanUkrainianUruguayanUteVenezuelanVietnameseWelshWest IndianYakamaYaquiYugoslavianYumanYup'ikZimbabwean
Immigration
NonimmigrantsImmigrantsAfghanistanAfricaAlbaniaArgentinaArmeniaAsiaAustraliaAustriaBahamasBangladeshBarbadosBelarusBelgiumBelizeBoliviaBosnia and HerzegovinaBrazilBulgariaBurma/MyanmarCabo VerdeCambodiaCameroonCanadaCaribbeanCentral AmericaChileChinaColombiaCongoCosta RicaCroatiaCubaCzechoslovakiaDenmarkDominicaDominican RepublicEastern AfricaEastern AsiaEastern EuropeEcuadorEgyptEl SalvadorEnglandEritreaEthiopiaEuropeFijiFranceGermanyGhanaGreeceGrenadaGuatemalaGuyanaHaitiHondurasHong KongHungaryIndiaIndonesiaIranIraqIrelandIsraelItalyJamaicaJapanJordanKazakhstanKenyaKoreaKuwaitLaosLatin AmericaLatviaLebanonLiberiaLithuaniaMalaysiaMexicoMicronesiaMiddle AfricaMoldovaMoroccoNepalNetherlandsNicaraguaNigeriaNorth AmericaNorth MacedoniaNorthern AfricaNorthern EuropeNorwayOceaniaPakistanPanamaPeruPhilippinesPolandPortugalRomaniaRussiaSaudi ArabiaScotlandSenegalSerbiaSierra LeoneSingaporeSomaliaSouth AfricaSouth AmericaSouth Central AsiaSouth Eastern AsiaSouthern EuropeSpainSri LankaSt. Vincent and the GrenadinesSudanSwedenSwitzerlandSyriaTaiwanThailandTrinidad and TobagoTurkeyUgandaUkraineUruguayUzbekistanVenezuelaVietnamWest IndiesWestern AfricaWestern AsiaWestern EuropeYemenZaireZimbabweAzores
Okinawan
Race
Ancestry
AfghanAfricanAlaska NativeAlaskan AthabascanAlbanianAleutAlsatianAmericanApacheArabArapahoArgentineanArmenianAssyrian/Chaldean/SyriacAustralianAustrianBahamianBangladeshiBarbadianBasqueBelgianBelizeanBermudanBhutaneseBlackfeetBolivianBrazilianBritishBritish West IndianBulgarianBurmeseCajunCambodianCanadianCape VerdeanCarpatho RusynCelticCentral AmericanCentral American IndianCherokeeCheyenneChickasawChileanChineseChippewaChoctawColombianColvilleComancheCosta RicanCreeCreekCroatianCrowCubanCypriotCzechCzechoslovakianDanishDelawareDominicanDutchDutch West IndianEastern EuropeanEcuadorianEgyptianEnglishEstonianEthiopianEuropeanFijianFilipinoFinnishFrenchFrench American IndianFrench CanadianGermanGerman RussianGhanaianGreekGuamanian/ChamorroGuatemalanGuyaneseHaitianHmongHonduranHopiHoumaHungarianIcelanderIndian (Asian)IndonesianInupiatIranianIraqiIrishIroquoisIsraeliItalianJamaicanJapaneseJordanianKenyanKiowaKoreanLaotianLatvianLebaneseLiberianLithuanianLumbeeLuxembourgerMacedonianMalaysianMalteseMarshalleseMenomineeMexicanMexican American IndianMongolianMoroccanNative HawaiianNavajoNepaleseNew ZealanderNicaraguanNigerianNorthern EuropeanNorwegianOkinawanOsageOttawaPaiutePakistaniPalestinianPanamanianParaguayanPennsylvania GermanPeruvianPimaPolishPortuguesePotawatomiPuebloPuerto RicanPuget Sound SalishRomanianRussianSalvadoranSamoanScandinavianScotch-IrishScottishSeminoleSenegaleseSerbianShoshoneSierra LeoneanSiouxSlavicSlovakSloveneSomaliSouth AfricanSouth AmericanSouth American IndianSoviet UnionSpaniardSpanishSpanish AmericanSpanish American IndianSri LankanSubsaharan AfricanSudaneseSwedishSwissSyrianTaiwaneseThaiTlingit-HaidaTohono O'OdhamTonganTrinidadian and TobagonianTsimshianTurkishU.S. Virgin IslanderUgandanUkrainianUruguayanUteVenezuelanVietnameseWelshWest IndianYakamaYaquiYugoslavianYumanYup'ikZimbabwean
Immigration
NonimmigrantsImmigrantsAfghanistanAfricaAlbaniaArgentinaArmeniaAsiaAustraliaAustriaBahamasBangladeshBarbadosBelarusBelgiumBelizeBoliviaBosnia and HerzegovinaBrazilBulgariaBurma/MyanmarCabo VerdeCambodiaCameroonCanadaCaribbeanCentral AmericaChileChinaColombiaCosta RicaCroatiaCubaCzechoslovakiaDenmarkDominicaDominican RepublicEastern AfricaEastern AsiaEastern EuropeEcuadorEgyptEl SalvadorEnglandEritreaEthiopiaEuropeFijiFranceGermanyGhanaGreeceGrenadaGuatemalaGuyanaHaitiHondurasHong KongHungaryIndiaIndonesiaIranIraqIrelandIsraelItalyJamaicaJapanJordanKazakhstanKenyaKoreaKuwaitLaosLatin AmericaLatviaLebanonLiberiaLithuaniaMalaysiaMexicoMicronesiaMiddle AfricaMoldovaMoroccoNepalNetherlandsNicaraguaNigeriaNorth AmericaNorth MacedoniaNorthern AfricaNorthern EuropeNorwayOceaniaPakistanPanamaPeruPhilippinesPolandPortugalRomaniaRussiaSaudi ArabiaScotlandSenegalSerbiaSierra LeoneSingaporeSomaliaSouth AfricaSouth AmericaSouth Central AsiaSouth Eastern AsiaSouthern EuropeSpainSri LankaSt. Vincent and the GrenadinesSudanSwedenSwitzerlandSyriaTaiwanThailandTrinidad and TobagoTurkeyUgandaUkraineUruguayUzbekistanVenezuelaVietnamWest IndiesWestern AfricaWestern AsiaWestern EuropeYemenZaireZimbabweAzores
Unemployment Among Ages 45 to 54 years
Income
Poverty
Unemployment
Labor Participation
Family Structure
Vehicle Availability
Education Level
Disability

Unemployment Among Ages 45 to 54 years Comparison

Immigrants from Congo

Okinawans

Excellent
Exceptional
4.4%
UNEMPLOYMENT AMONG AGES 45 TO 54 YEARS
81.8/ 100
METRIC RATING
138th/ 347
METRIC RANK
4.3%
UNEMPLOYMENT AMONG AGES 45 TO 54 YEARS
99.2/ 100
METRIC RATING
59th/ 347
METRIC RANK

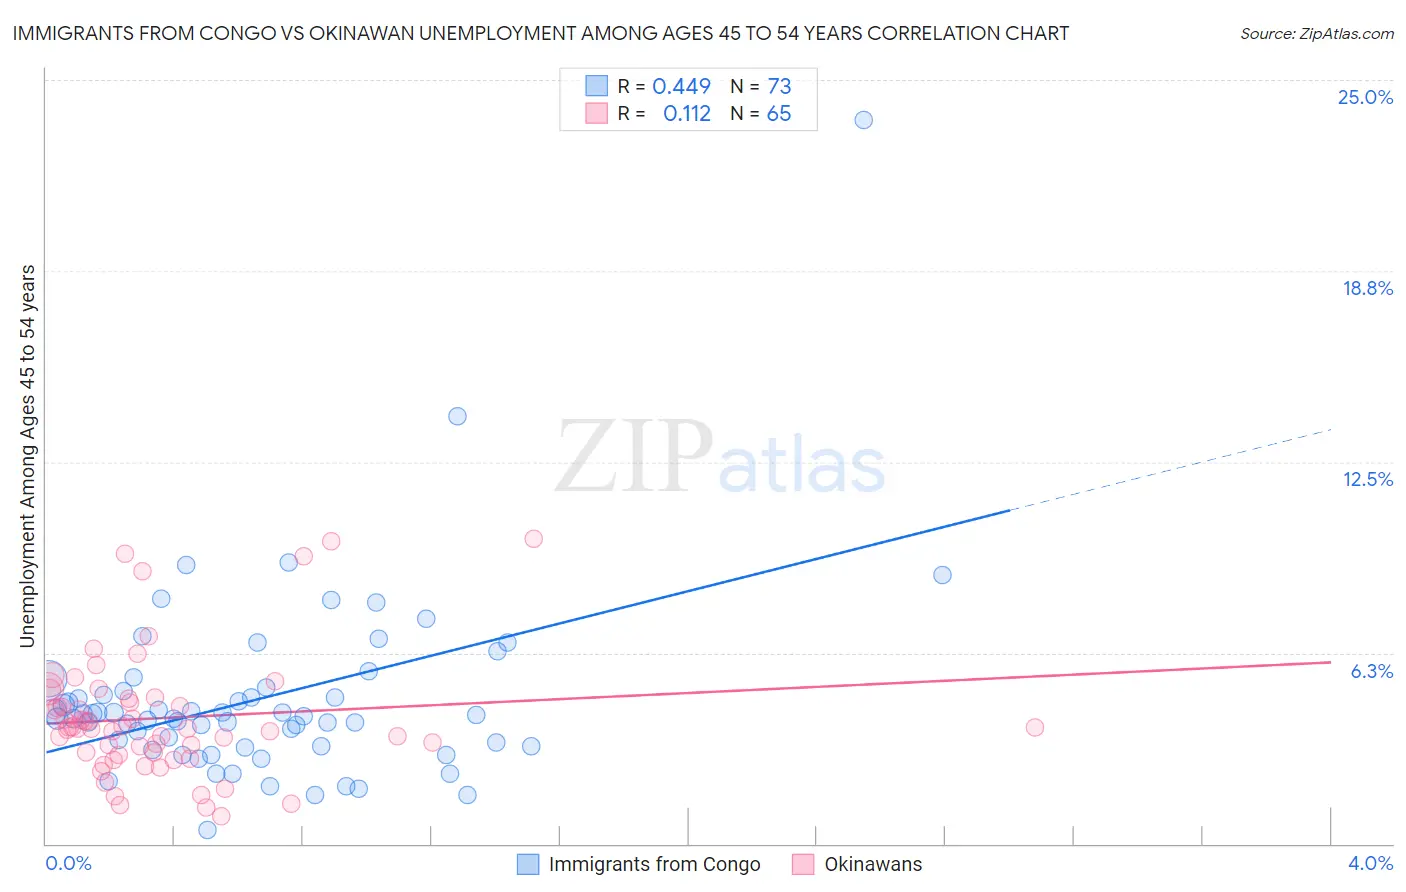
Immigrants from Congo vs Okinawan Unemployment Among Ages 45 to 54 years Correlation Chart

The statistical analysis conducted on geographies consisting of 91,534,278 people shows a moderate positive correlation between the proportion of Immigrants from Congo and unemployment rate among population between the ages 45 and 54 in the United States with a correlation coefficient (R) of 0.449 and weighted average of 4.4%. Similarly, the statistical analysis conducted on geographies consisting of 73,474,495 people shows a poor positive correlation between the proportion of Okinawans and unemployment rate among population between the ages 45 and 54 in the United States with a correlation coefficient (R) of 0.112 and weighted average of 4.3%, a difference of 4.2%.
Immigrants from Congo vs Okinawan Unemployment Among Ages 45 to 54 years

Unemployment Among Ages 45 to 54 years Correlation Summary

MeasurementImmigrants from CongoOkinawan
Minimum0.45%0.90%
Maximum23.7%10.0%
Range23.3%9.1%
Mean4.7%4.1%
Median4.2%3.8%
Interquartile 25% (IQ1)3.2%2.9%
Interquartile 75% (IQ3)5.1%4.8%
Interquartile Range (IQR)1.9%1.8%
Standard Deviation (Sample)3.1%2.0%
Standard Deviation (Population)3.1%2.0%

Similar Demographics by Unemployment Among Ages 45 to 54 years

Demographics Similar to Immigrants from Congo by Unemployment Among Ages 45 to 54 years

In terms of unemployment among ages 45 to 54 years, the demographic groups most similar to Immigrants from Congo are Lebanese (4.4%, a difference of 0.010%), Immigrants from Kuwait (4.4%, a difference of 0.010%), Immigrants from Zaire (4.4%, a difference of 0.090%), Immigrants from Middle Africa (4.4%, a difference of 0.13%), and Immigrants from Afghanistan (4.4%, a difference of 0.16%).
DemographicsRating | RankUnemployment Among Ages 45 to 54 years
Immigrants | Germany
85.9
/100
|
#131
Excellent
4.4%
Immigrants | Eastern Africa
85.1
/100
|
#132
Excellent
4.4%
Immigrants | Cameroon
84.8
/100
|
#133
Excellent
4.4%
Afghans
84.6
/100
|
#134
Excellent
4.4%
Immigrants | Eastern Asia
84.0
/100
|
#135
Excellent
4.4%
Immigrants | Middle Africa
83.3
/100
|
#136
Excellent
4.4%
Lebanese
81.9
/100
|
#137
Excellent
4.4%
Immigrants | Congo
81.8
/100
|
#138
Excellent
4.4%
Immigrants | Kuwait
81.7
/100
|
#139
Excellent
4.4%
Immigrants | Zaire
80.7
/100
|
#140
Excellent
4.4%
Immigrants | Afghanistan
79.6
/100
|
#141
Good
4.4%
Immigrants | Netherlands
79.4
/100
|
#142
Good
4.4%
Macedonians
79.0
/100
|
#143
Good
4.5%
Taiwanese
77.9
/100
|
#144
Good
4.5%
Immigrants | Latvia
77.5
/100
|
#145
Good
4.5%

Demographics Similar to Okinawans by Unemployment Among Ages 45 to 54 years

In terms of unemployment among ages 45 to 54 years, the demographic groups most similar to Okinawans are Immigrants from Korea (4.3%, a difference of 0.030%), Immigrants from Pakistan (4.3%, a difference of 0.040%), Greek (4.3%, a difference of 0.080%), Immigrants from Sri Lanka (4.3%, a difference of 0.13%), and Lithuanian (4.3%, a difference of 0.17%).
DemographicsRating | RankUnemployment Among Ages 45 to 54 years
Poles
99.5
/100
|
#52
Exceptional
4.2%
Irish
99.5
/100
|
#53
Exceptional
4.2%
Chickasaw
99.5
/100
|
#54
Exceptional
4.2%
Latvians
99.4
/100
|
#55
Exceptional
4.2%
Immigrants | Jordan
99.3
/100
|
#56
Exceptional
4.3%
Immigrants | Sri Lanka
99.3
/100
|
#57
Exceptional
4.3%
Greeks
99.3
/100
|
#58
Exceptional
4.3%
Okinawans
99.2
/100
|
#59
Exceptional
4.3%
Immigrants | Korea
99.2
/100
|
#60
Exceptional
4.3%
Immigrants | Pakistan
99.2
/100
|
#61
Exceptional
4.3%
Lithuanians
99.1
/100
|
#62
Exceptional
4.3%
Pennsylvania Germans
99.1
/100
|
#63
Exceptional
4.3%
Austrians
99.0
/100
|
#64
Exceptional
4.3%
Immigrants | Sudan
99.0
/100
|
#65
Exceptional
4.3%
Turks
98.9
/100
|
#66
Exceptional
4.3%