Immigrants from Colombia vs Tohono O'odham Unemployment Among Ages 25 to 29 years

COMPARE

Immigrants from Colombia
Race
Ancestry
AfghanAfricanAlaska NativeAlaskan AthabascanAlbanianAleutAlsatianAmericanApacheArabArapahoArgentineanArmenianAssyrian/Chaldean/SyriacAustralianAustrianBahamianBangladeshiBarbadianBasqueBelgianBelizeanBermudanBhutaneseBlackfeetBolivianBrazilianBritishBritish West IndianBulgarianBurmeseCajunCambodianCanadianCape VerdeanCarpatho RusynCelticCentral AmericanCentral American IndianCherokeeCheyenneChickasawChileanChineseChippewaChoctawColombianColvilleComancheCosta RicanCreeCreekCroatianCrowCubanCypriotCzechCzechoslovakianDanishDelawareDominicanDutchDutch West IndianEastern EuropeanEcuadorianEgyptianEnglishEstonianEthiopianEuropeanFijianFilipinoFinnishFrenchFrench American IndianFrench CanadianGermanGerman RussianGhanaianGreekGuamanian/ChamorroGuatemalanGuyaneseHaitianHmongHonduranHopiHoumaHungarianIcelanderIndian (Asian)IndonesianInupiatIranianIraqiIrishIroquoisIsraeliItalianJamaicanJapaneseJordanianKenyanKiowaKoreanLaotianLatvianLebaneseLiberianLithuanianLumbeeLuxembourgerMacedonianMalaysianMalteseMarshalleseMenomineeMexicanMexican American IndianMongolianMoroccanNative HawaiianNavajoNepaleseNew ZealanderNicaraguanNigerianNorthern EuropeanNorwegianOkinawanOsageOttawaPaiutePakistaniPalestinianPanamanianParaguayanPennsylvania GermanPeruvianPimaPolishPortuguesePotawatomiPuebloPuerto RicanPuget Sound SalishRomanianRussianSalvadoranSamoanScandinavianScotch-IrishScottishSeminoleSenegaleseSerbianShoshoneSierra LeoneanSiouxSlavicSlovakSloveneSomaliSouth AfricanSouth AmericanSouth American IndianSoviet UnionSpaniardSpanishSpanish AmericanSpanish American IndianSri LankanSubsaharan AfricanSudaneseSwedishSwissSyrianTaiwaneseThaiTlingit-HaidaTonganTrinidadian and TobagonianTsimshianTurkishU.S. Virgin IslanderUgandanUkrainianUruguayanUteVenezuelanVietnameseWelshWest IndianYakamaYaquiYugoslavianYumanYup'ikZimbabwean
Immigration
NonimmigrantsImmigrantsAfghanistanAfricaAlbaniaArgentinaArmeniaAsiaAustraliaAustriaBahamasBangladeshBarbadosBelarusBelgiumBelizeBoliviaBosnia and HerzegovinaBrazilBulgariaBurma/MyanmarCabo VerdeCambodiaCameroonCanadaCaribbeanCentral AmericaChileChinaColombiaCongoCosta RicaCroatiaCubaCzechoslovakiaDenmarkDominicaDominican RepublicEastern AfricaEastern AsiaEastern EuropeEcuadorEgyptEl SalvadorEnglandEritreaEthiopiaEuropeFijiFranceGermanyGhanaGreeceGrenadaGuatemalaGuyanaHaitiHondurasHong KongHungaryIndiaIndonesiaIranIraqIrelandIsraelItalyJamaicaJapanJordanKazakhstanKenyaKoreaKuwaitLaosLatin AmericaLatviaLebanonLiberiaLithuaniaMalaysiaMexicoMicronesiaMiddle AfricaMoldovaMoroccoNepalNetherlandsNicaraguaNigeriaNorth AmericaNorth MacedoniaNorthern AfricaNorthern EuropeNorwayOceaniaPakistanPanamaPeruPhilippinesPolandPortugalRomaniaRussiaSaudi ArabiaScotlandSenegalSerbiaSierra LeoneSingaporeSomaliaSouth AfricaSouth AmericaSouth Central AsiaSouth Eastern AsiaSouthern EuropeSpainSri LankaSt. Vincent and the GrenadinesSudanSwedenSwitzerlandSyriaTaiwanThailandTrinidad and TobagoTurkeyUgandaUkraineUruguayUzbekistanVenezuelaVietnamWest IndiesWestern AfricaWestern AsiaWestern EuropeYemenZaireZimbabweAzores
Tohono O'odham
Race
Ancestry
AfghanAfricanAlaska NativeAlaskan AthabascanAlbanianAleutAlsatianAmericanApacheArabArapahoArgentineanArmenianAssyrian/Chaldean/SyriacAustralianAustrianBahamianBangladeshiBarbadianBasqueBelgianBelizeanBermudanBhutaneseBlackfeetBolivianBrazilianBritishBritish West IndianBulgarianBurmeseCajunCambodianCanadianCape VerdeanCarpatho RusynCelticCentral AmericanCentral American IndianCherokeeCheyenneChickasawChileanChineseChippewaChoctawColombianColvilleComancheCosta RicanCreeCreekCroatianCrowCubanCypriotCzechCzechoslovakianDanishDelawareDominicanDutchDutch West IndianEastern EuropeanEcuadorianEgyptianEnglishEstonianEthiopianEuropeanFijianFilipinoFinnishFrenchFrench American IndianFrench CanadianGermanGerman RussianGhanaianGreekGuamanian/ChamorroGuatemalanGuyaneseHaitianHmongHonduranHopiHoumaHungarianIcelanderIndian (Asian)IndonesianInupiatIranianIraqiIrishIroquoisIsraeliItalianJamaicanJapaneseJordanianKenyanKiowaKoreanLaotianLatvianLebaneseLiberianLithuanianLumbeeLuxembourgerMacedonianMalaysianMalteseMarshalleseMenomineeMexicanMexican American IndianMongolianMoroccanNative HawaiianNavajoNepaleseNew ZealanderNicaraguanNigerianNorthern EuropeanNorwegianOkinawanOsageOttawaPaiutePakistaniPalestinianPanamanianParaguayanPennsylvania GermanPeruvianPimaPolishPortuguesePotawatomiPuebloPuerto RicanPuget Sound SalishRomanianRussianSalvadoranSamoanScandinavianScotch-IrishScottishSeminoleSenegaleseSerbianShoshoneSierra LeoneanSiouxSlavicSlovakSloveneSomaliSouth AfricanSouth AmericanSouth American IndianSoviet UnionSpaniardSpanishSpanish AmericanSpanish American IndianSri LankanSubsaharan AfricanSudaneseSwedishSwissSyrianTaiwaneseThaiTlingit-HaidaTohono O'OdhamTonganTrinidadian and TobagonianTsimshianTurkishU.S. Virgin IslanderUgandanUkrainianUruguayanUteVenezuelanVietnameseWelshWest IndianYakamaYaquiYugoslavianYumanYup'ikZimbabwean
Immigration
NonimmigrantsImmigrantsAfghanistanAfricaAlbaniaArgentinaArmeniaAsiaAustraliaAustriaBahamasBangladeshBarbadosBelarusBelgiumBelizeBoliviaBosnia and HerzegovinaBrazilBulgariaBurma/MyanmarCabo VerdeCambodiaCameroonCanadaCaribbeanCentral AmericaChileChinaCongoCosta RicaCroatiaCubaCzechoslovakiaDenmarkDominicaDominican RepublicEastern AfricaEastern AsiaEastern EuropeEcuadorEgyptEl SalvadorEnglandEritreaEthiopiaEuropeFijiFranceGermanyGhanaGreeceGrenadaGuatemalaGuyanaHaitiHondurasHong KongHungaryIndiaIndonesiaIranIraqIrelandIsraelItalyJamaicaJapanJordanKazakhstanKenyaKoreaKuwaitLaosLatin AmericaLatviaLebanonLiberiaLithuaniaMalaysiaMexicoMicronesiaMiddle AfricaMoldovaMoroccoNepalNetherlandsNicaraguaNigeriaNorth AmericaNorth MacedoniaNorthern AfricaNorthern EuropeNorwayOceaniaPakistanPanamaPeruPhilippinesPolandPortugalRomaniaRussiaSaudi ArabiaScotlandSenegalSerbiaSierra LeoneSingaporeSomaliaSouth AfricaSouth AmericaSouth Central AsiaSouth Eastern AsiaSouthern EuropeSpainSri LankaSt. Vincent and the GrenadinesSudanSwedenSwitzerlandSyriaTaiwanThailandTrinidad and TobagoTurkeyUgandaUkraineUruguayUzbekistanVenezuelaVietnamWest IndiesWestern AfricaWestern AsiaWestern EuropeYemenZaireZimbabweAzores
Unemployment Among Ages 25 to 29 years
Income
Poverty
Unemployment
Labor Participation
Family Structure
Vehicle Availability
Education Level
Disability

Unemployment Among Ages 25 to 29 years Comparison

Immigrants from Colombia

Tohono O'odham

Excellent
Tragic
6.4%
UNEMPLOYMENT AMONG AGES 25 TO 29 YEARS
87.6/ 100
METRIC RATING
111th/ 347
METRIC RANK
12.1%
UNEMPLOYMENT AMONG AGES 25 TO 29 YEARS
0.0/ 100
METRIC RATING
341st/ 347
METRIC RANK

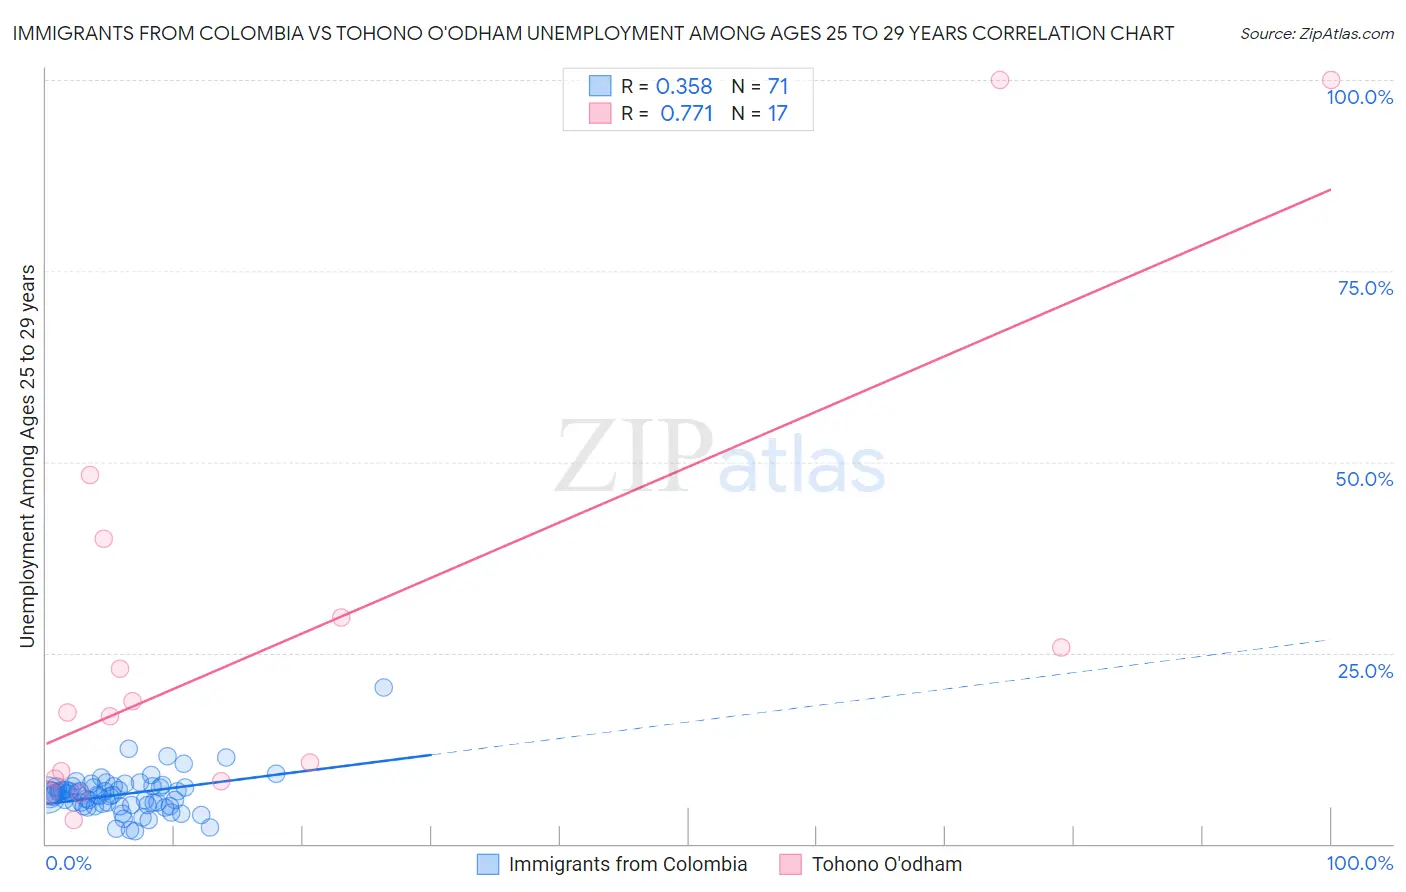
Immigrants from Colombia vs Tohono O'odham Unemployment Among Ages 25 to 29 years Correlation Chart

The statistical analysis conducted on geographies consisting of 362,771,593 people shows a mild positive correlation between the proportion of Immigrants from Colombia and unemployment rate among population between the ages 25 and 29 in the United States with a correlation coefficient (R) of 0.358 and weighted average of 6.4%. Similarly, the statistical analysis conducted on geographies consisting of 58,234,403 people shows a strong positive correlation between the proportion of Tohono O'odham and unemployment rate among population between the ages 25 and 29 in the United States with a correlation coefficient (R) of 0.771 and weighted average of 12.1%, a difference of 87.3%.
Immigrants from Colombia vs Tohono O'odham Unemployment Among Ages 25 to 29 years

Unemployment Among Ages 25 to 29 years Correlation Summary

MeasurementImmigrants from ColombiaTohono O'odham
Minimum1.6%3.0%
Maximum20.4%100.0%
Range18.8%97.0%
Mean6.5%27.8%
Median6.3%17.1%
Interquartile 25% (IQ1)5.0%8.3%
Interquartile 75% (IQ3)7.4%34.9%
Interquartile Range (IQR)2.4%26.5%
Standard Deviation (Sample)2.7%29.8%
Standard Deviation (Population)2.7%28.9%

Similar Demographics by Unemployment Among Ages 25 to 29 years

Demographics Similar to Immigrants from Colombia by Unemployment Among Ages 25 to 29 years

In terms of unemployment among ages 25 to 29 years, the demographic groups most similar to Immigrants from Colombia are Immigrants from Nicaragua (6.4%, a difference of 0.020%), European (6.4%, a difference of 0.040%), Immigrants from Albania (6.4%, a difference of 0.050%), Immigrants from Egypt (6.5%, a difference of 0.070%), and Croatian (6.4%, a difference of 0.090%).
DemographicsRating | RankUnemployment Among Ages 25 to 29 years
Cypriots
90.1
/100
|
#104
Exceptional
6.4%
Immigrants | Kazakhstan
89.8
/100
|
#105
Excellent
6.4%
Immigrants | Hungary
89.4
/100
|
#106
Excellent
6.4%
Swiss
88.6
/100
|
#107
Excellent
6.4%
Croatians
88.2
/100
|
#108
Excellent
6.4%
Immigrants | Albania
87.9
/100
|
#109
Excellent
6.4%
Europeans
87.8
/100
|
#110
Excellent
6.4%
Immigrants | Colombia
87.6
/100
|
#111
Excellent
6.4%
Immigrants | Nicaragua
87.5
/100
|
#112
Excellent
6.4%
Immigrants | Egypt
87.1
/100
|
#113
Excellent
6.5%
Germans
86.3
/100
|
#114
Excellent
6.5%
Macedonians
86.1
/100
|
#115
Excellent
6.5%
Pakistanis
85.9
/100
|
#116
Excellent
6.5%
Immigrants | Uruguay
85.7
/100
|
#117
Excellent
6.5%
Chileans
85.3
/100
|
#118
Excellent
6.5%

Demographics Similar to Tohono O'odham by Unemployment Among Ages 25 to 29 years

In terms of unemployment among ages 25 to 29 years, the demographic groups most similar to Tohono O'odham are Navajo (12.2%, a difference of 0.80%), Cheyenne (11.8%, a difference of 2.1%), Pima (11.8%, a difference of 2.5%), Sioux (11.7%, a difference of 3.5%), and Menominee (11.3%, a difference of 7.1%).
DemographicsRating | RankUnemployment Among Ages 25 to 29 years
Alaskan Athabascans
0.0
/100
|
#333
Tragic
10.8%
Yuman
0.0
/100
|
#334
Tragic
11.0%
Puerto Ricans
0.0
/100
|
#335
Tragic
11.1%
Lumbee
0.0
/100
|
#336
Tragic
11.2%
Menominee
0.0
/100
|
#337
Tragic
11.3%
Sioux
0.0
/100
|
#338
Tragic
11.7%
Pima
0.0
/100
|
#339
Tragic
11.8%
Cheyenne
0.0
/100
|
#340
Tragic
11.8%
Tohono O'odham
0.0
/100
|
#341
Tragic
12.1%
Navajo
0.0
/100
|
#342
Tragic
12.2%
Inupiat
0.0
/100
|
#343
Tragic
13.4%
Hopi
0.0
/100
|
#344
Tragic
13.5%
Arapaho
0.0
/100
|
#345
Tragic
15.4%
Crow
0.0
/100
|
#346
Tragic
15.4%
Yup'ik
0.0
/100
|
#347
Tragic
17.9%