Immigrants from Colombia vs Menominee Unemployment Among Ages 55 to 59 years
COMPARE
Immigrants from Colombia
Menominee
Unemployment Among Ages 55 to 59 years
Unemployment Among Ages 55 to 59 years Comparison
Immigrants from Colombia
Menominee
4.7%
UNEMPLOYMENT AMONG AGES 55 TO 59 YEARS
96.9/ 100
METRIC RATING
86th/ 347
METRIC RANK
10.5%
UNEMPLOYMENT AMONG AGES 55 TO 59 YEARS
0.0/ 100
METRIC RATING
346th/ 347
METRIC RANK
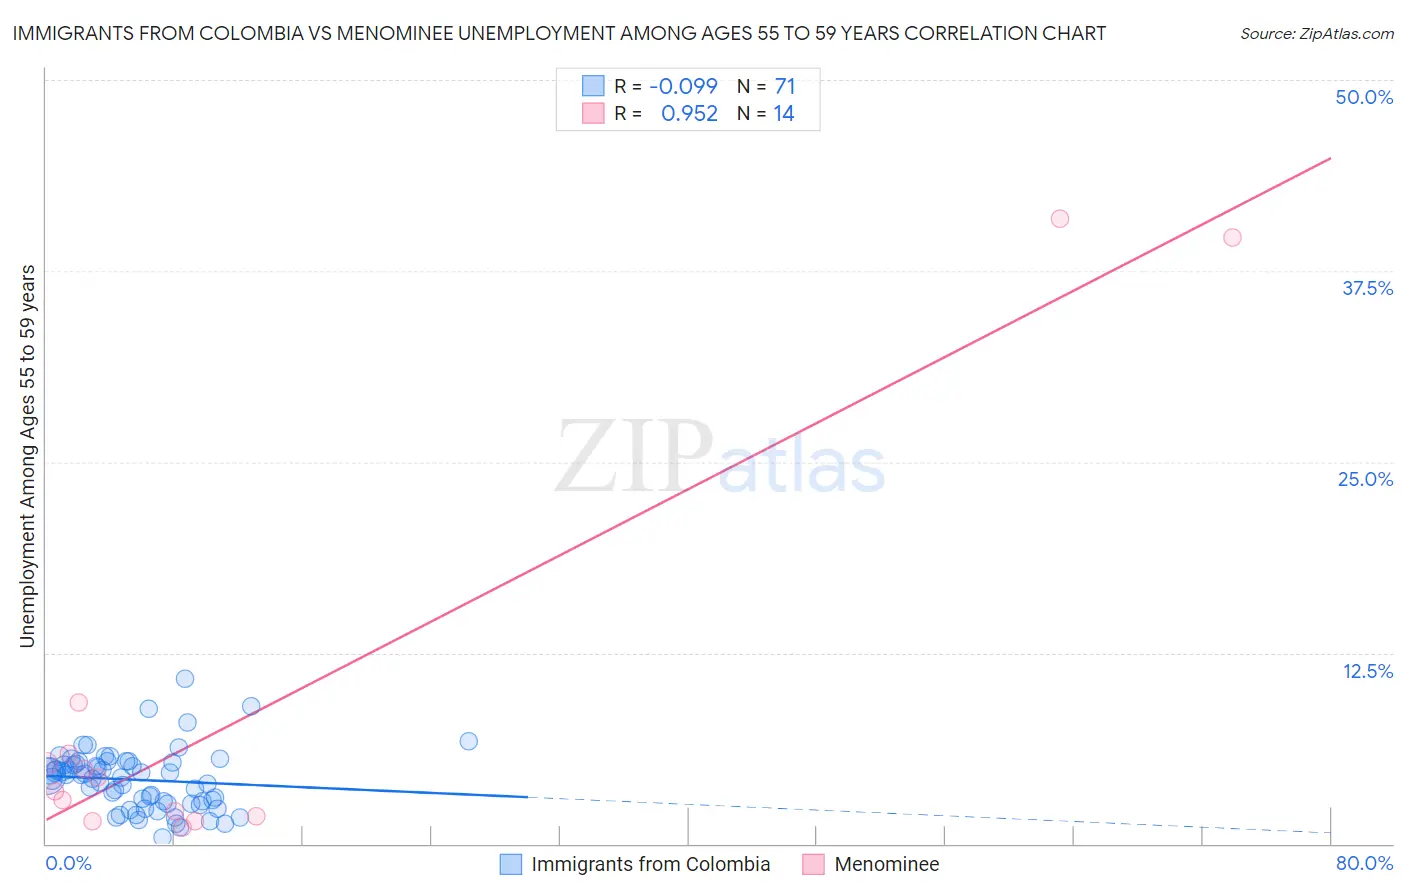
Immigrants from Colombia vs Menominee Unemployment Among Ages 55 to 59 years Correlation Chart
The statistical analysis conducted on geographies consisting of 355,214,802 people shows a slight negative correlation between the proportion of Immigrants from Colombia and unemployment rate among population between the ages 55 and 59 in the United States with a correlation coefficient (R) of -0.099 and weighted average of 4.7%. Similarly, the statistical analysis conducted on geographies consisting of 44,393,240 people shows a perfect positive correlation between the proportion of Menominee and unemployment rate among population between the ages 55 and 59 in the United States with a correlation coefficient (R) of 0.952 and weighted average of 10.5%, a difference of 126.7%.
Unemployment Among Ages 55 to 59 years Correlation Summary
| Measurement | Immigrants from Colombia | Menominee |
| Minimum | 0.40% | 1.1% |
| Maximum | 10.8% | 40.9% |
| Range | 10.4% | 39.8% |
| Mean | 4.2% | 8.9% |
| Median | 4.4% | 3.9% |
| Interquartile 25% (IQ1) | 2.6% | 1.8% |
| Interquartile 75% (IQ3) | 5.3% | 5.9% |
| Interquartile Range (IQR) | 2.7% | 4.1% |
| Standard Deviation (Sample) | 2.0% | 13.5% |
| Standard Deviation (Population) | 1.9% | 13.0% |
Similar Demographics by Unemployment Among Ages 55 to 59 years
Demographics Similar to Immigrants from Colombia by Unemployment Among Ages 55 to 59 years
In terms of unemployment among ages 55 to 59 years, the demographic groups most similar to Immigrants from Colombia are Malaysian (4.7%, a difference of 0.0%), Immigrants from Vietnam (4.7%, a difference of 0.0%), Polish (4.7%, a difference of 0.020%), Immigrants from Cameroon (4.7%, a difference of 0.020%), and Irish (4.7%, a difference of 0.040%).
| Demographics | Rating | Rank | Unemployment Among Ages 55 to 59 years |
| Sri Lankans | 98.1 /100 | #79 | Exceptional 4.6% |
| Cambodians | 98.0 /100 | #80 | Exceptional 4.6% |
| Taiwanese | 97.9 /100 | #81 | Exceptional 4.6% |
| Latvians | 97.8 /100 | #82 | Exceptional 4.6% |
| Lebanese | 97.5 /100 | #83 | Exceptional 4.6% |
| Malaysians | 96.9 /100 | #84 | Exceptional 4.7% |
| Immigrants | Vietnam | 96.9 /100 | #85 | Exceptional 4.7% |
| Immigrants | Colombia | 96.9 /100 | #86 | Exceptional 4.7% |
| Poles | 96.9 /100 | #87 | Exceptional 4.7% |
| Immigrants | Cameroon | 96.9 /100 | #88 | Exceptional 4.7% |
| Irish | 96.8 /100 | #89 | Exceptional 4.7% |
| Immigrants | Poland | 96.4 /100 | #90 | Exceptional 4.7% |
| New Zealanders | 96.3 /100 | #91 | Exceptional 4.7% |
| Iraqis | 96.1 /100 | #92 | Exceptional 4.7% |
| Immigrants | England | 95.8 /100 | #93 | Exceptional 4.7% |
Demographics Similar to Menominee by Unemployment Among Ages 55 to 59 years
In terms of unemployment among ages 55 to 59 years, the demographic groups most similar to Menominee are Tohono O'odham (9.3%, a difference of 13.1%), Inupiat (9.0%, a difference of 16.6%), Yakama (8.9%, a difference of 18.0%), Hopi (8.1%, a difference of 29.8%), and Yup'ik (13.9%, a difference of 32.2%).
| Demographics | Rating | Rank | Unemployment Among Ages 55 to 59 years |
| Pima | 0.0 /100 | #333 | Tragic 6.6% |
| Pueblo | 0.0 /100 | #334 | Tragic 6.7% |
| Colville | 0.0 /100 | #335 | Tragic 6.7% |
| Navajo | 0.0 /100 | #336 | Tragic 6.7% |
| Paiute | 0.0 /100 | #337 | Tragic 6.8% |
| Immigrants | Yemen | 0.0 /100 | #338 | Tragic 6.9% |
| Puerto Ricans | 0.0 /100 | #339 | Tragic 7.0% |
| Alaskan Athabascans | 0.0 /100 | #340 | Tragic 7.1% |
| Shoshone | 0.0 /100 | #341 | Tragic 7.4% |
| Hopi | 0.0 /100 | #342 | Tragic 8.1% |
| Yakama | 0.0 /100 | #343 | Tragic 8.9% |
| Inupiat | 0.0 /100 | #344 | Tragic 9.0% |
| Tohono O'odham | 0.0 /100 | #345 | Tragic 9.3% |
| Menominee | 0.0 /100 | #346 | Tragic 10.5% |
| Yup'ik | 0.0 /100 | #347 | Tragic 13.9% |