Immigrants from China vs Immigrants from Costa Rica Unemployment Among Women with Children Under 18 years
COMPARE
Immigrants from China
Immigrants from Costa Rica
Unemployment Among Women with Children Under 18 years
Unemployment Among Women with Children Under 18 years Comparison
Immigrants from China
Immigrants from Costa Rica
4.9%
UNEMPLOYMENT AMONG WOMEN WITH CHILDREN UNDER 18 YEARS
99.6/ 100
METRIC RATING
23rd/ 347
METRIC RANK
5.6%
UNEMPLOYMENT AMONG WOMEN WITH CHILDREN UNDER 18 YEARS
11.6/ 100
METRIC RATING
208th/ 347
METRIC RANK
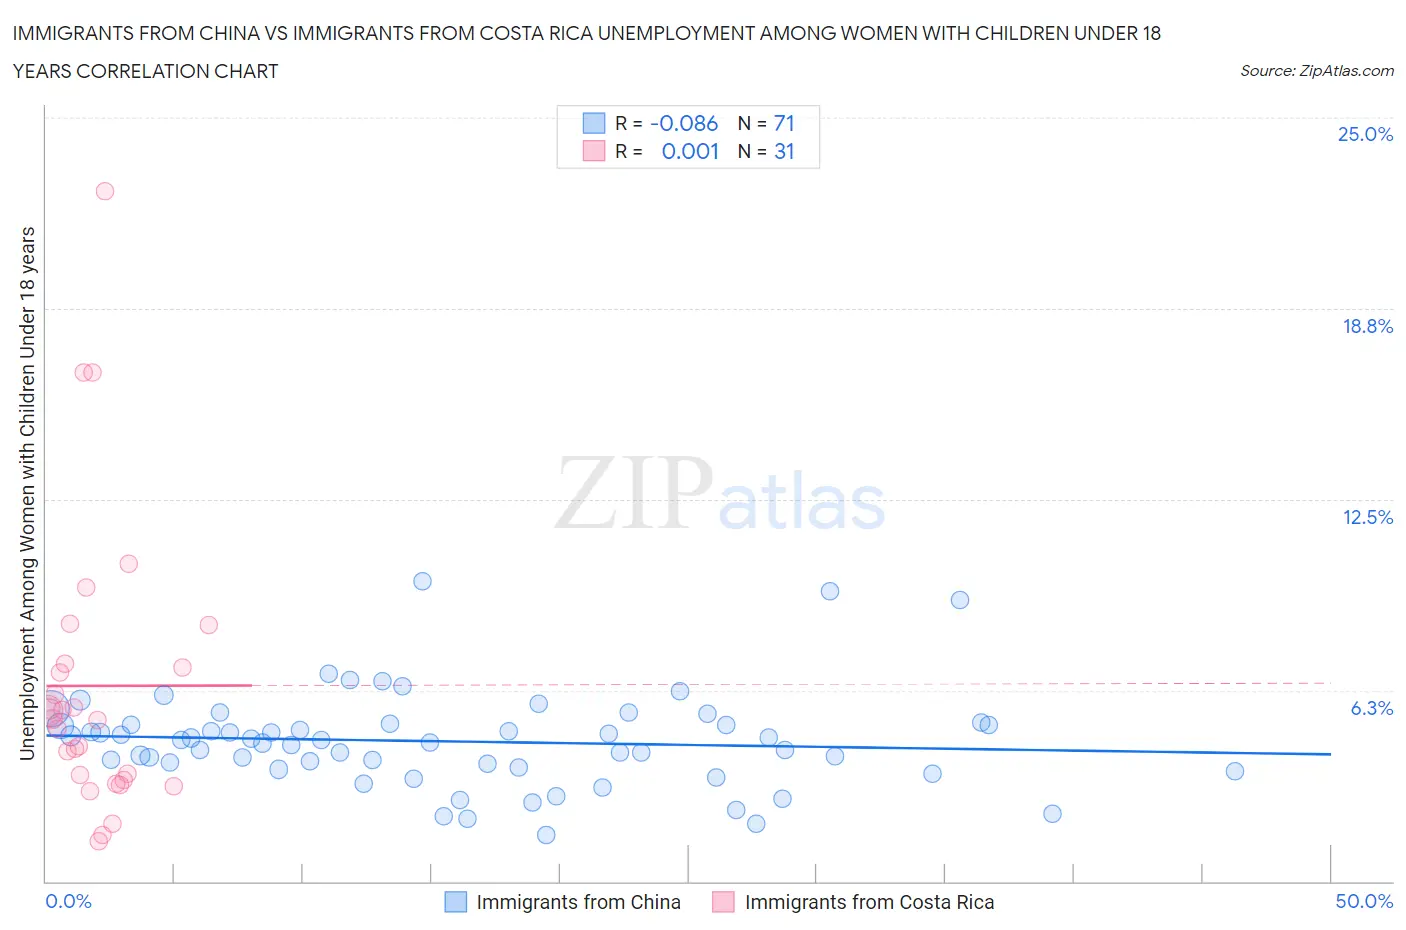
Immigrants from China vs Immigrants from Costa Rica Unemployment Among Women with Children Under 18 years Correlation Chart
The statistical analysis conducted on geographies consisting of 434,778,409 people shows a slight negative correlation between the proportion of Immigrants from China and unemployment rate among women with children under the age of 18 in the United States with a correlation coefficient (R) of -0.086 and weighted average of 4.9%. Similarly, the statistical analysis conducted on geographies consisting of 201,252,028 people shows no correlation between the proportion of Immigrants from Costa Rica and unemployment rate among women with children under the age of 18 in the United States with a correlation coefficient (R) of 0.001 and weighted average of 5.6%, a difference of 14.6%.
Unemployment Among Women with Children Under 18 years Correlation Summary
| Measurement | Immigrants from China | Immigrants from Costa Rica |
| Minimum | 1.5% | 1.3% |
| Maximum | 9.8% | 22.6% |
| Range | 8.3% | 21.3% |
| Mean | 4.6% | 6.4% |
| Median | 4.6% | 5.3% |
| Interquartile 25% (IQ1) | 3.7% | 3.3% |
| Interquartile 75% (IQ3) | 5.1% | 7.1% |
| Interquartile Range (IQR) | 1.4% | 3.8% |
| Standard Deviation (Sample) | 1.6% | 4.7% |
| Standard Deviation (Population) | 1.6% | 4.6% |
Similar Demographics by Unemployment Among Women with Children Under 18 years
Demographics Similar to Immigrants from China by Unemployment Among Women with Children Under 18 years
In terms of unemployment among women with children under 18 years, the demographic groups most similar to Immigrants from China are Belgian (4.9%, a difference of 0.090%), Chinese (4.9%, a difference of 0.10%), Indian (Asian) (4.9%, a difference of 0.20%), Swiss (4.9%, a difference of 0.21%), and Soviet Union (4.9%, a difference of 0.28%).
| Demographics | Rating | Rank | Unemployment Among Women with Children Under 18 years |
| Taiwanese | 99.8 /100 | #16 | Exceptional 4.8% |
| Immigrants | Singapore | 99.8 /100 | #17 | Exceptional 4.9% |
| Slovenes | 99.8 /100 | #18 | Exceptional 4.9% |
| Germans | 99.8 /100 | #19 | Exceptional 4.9% |
| Latvians | 99.7 /100 | #20 | Exceptional 4.9% |
| Europeans | 99.6 /100 | #21 | Exceptional 4.9% |
| Indians (Asian) | 99.6 /100 | #22 | Exceptional 4.9% |
| Immigrants | China | 99.6 /100 | #23 | Exceptional 4.9% |
| Belgians | 99.5 /100 | #24 | Exceptional 4.9% |
| Chinese | 99.5 /100 | #25 | Exceptional 4.9% |
| Swiss | 99.5 /100 | #26 | Exceptional 4.9% |
| Soviet Union | 99.5 /100 | #27 | Exceptional 4.9% |
| Immigrants | Eastern Asia | 99.5 /100 | #28 | Exceptional 4.9% |
| Finns | 99.4 /100 | #29 | Exceptional 4.9% |
| Burmese | 99.4 /100 | #30 | Exceptional 4.9% |
Demographics Similar to Immigrants from Costa Rica by Unemployment Among Women with Children Under 18 years
In terms of unemployment among women with children under 18 years, the demographic groups most similar to Immigrants from Costa Rica are Immigrants from Western Asia (5.6%, a difference of 0.060%), Peruvian (5.6%, a difference of 0.080%), Nicaraguan (5.6%, a difference of 0.12%), Nonimmigrants (5.7%, a difference of 0.17%), and Panamanian (5.7%, a difference of 0.27%).
| Demographics | Rating | Rank | Unemployment Among Women with Children Under 18 years |
| Immigrants | Morocco | 17.9 /100 | #201 | Poor 5.6% |
| Immigrants | Micronesia | 17.1 /100 | #202 | Poor 5.6% |
| Portuguese | 15.9 /100 | #203 | Poor 5.6% |
| Israelis | 15.6 /100 | #204 | Poor 5.6% |
| Tsimshian | 15.2 /100 | #205 | Poor 5.6% |
| Nicaraguans | 12.3 /100 | #206 | Poor 5.6% |
| Peruvians | 12.1 /100 | #207 | Poor 5.6% |
| Immigrants | Costa Rica | 11.6 /100 | #208 | Poor 5.6% |
| Immigrants | Western Asia | 11.3 /100 | #209 | Poor 5.6% |
| Immigrants | Nonimmigrants | 10.6 /100 | #210 | Poor 5.7% |
| Panamanians | 10.1 /100 | #211 | Poor 5.7% |
| South Americans | 10.0 /100 | #212 | Poor 5.7% |
| Americans | 8.9 /100 | #213 | Tragic 5.7% |
| Japanese | 8.7 /100 | #214 | Tragic 5.7% |
| Immigrants | Uganda | 7.9 /100 | #215 | Tragic 5.7% |