Immigrants from Central America vs Ottawa Unemployment Among Seniors over 65 years
COMPARE
Immigrants from Central America
Ottawa
Unemployment Among Seniors over 65 years
Unemployment Among Seniors over 65 years Comparison
Immigrants from Central America
Ottawa
5.7%
UNEMPLOYMENT AMONG SENIORS OVER 65 YEARS
0.0/ 100
METRIC RATING
316th/ 347
METRIC RANK
5.3%
UNEMPLOYMENT AMONG SENIORS OVER 65 YEARS
0.8/ 100
METRIC RATING
245th/ 347
METRIC RANK
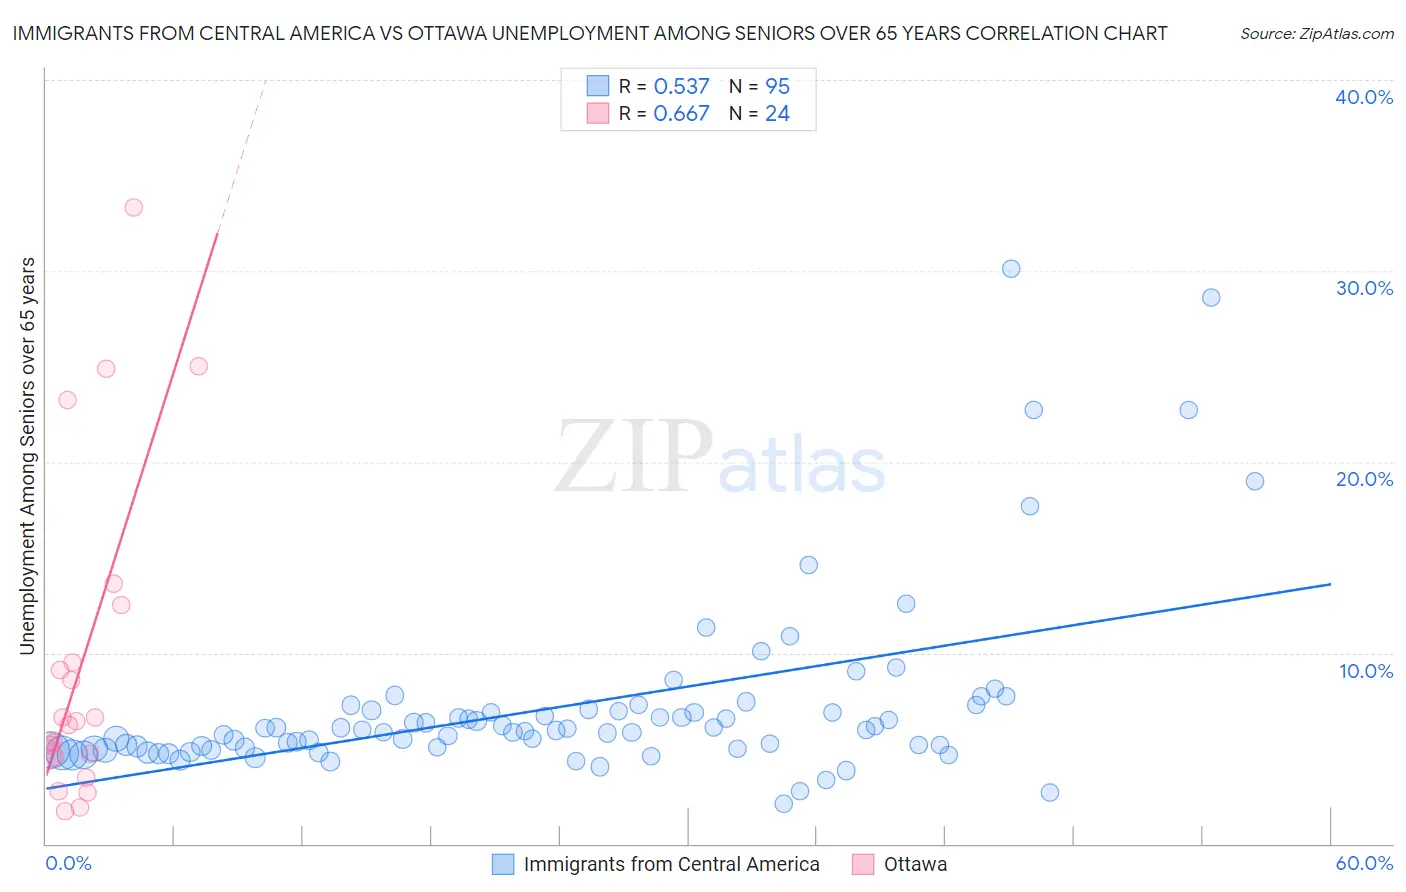
Immigrants from Central America vs Ottawa Unemployment Among Seniors over 65 years Correlation Chart
The statistical analysis conducted on geographies consisting of 447,102,649 people shows a substantial positive correlation between the proportion of Immigrants from Central America and unemployment rate amomg seniors over the age of 65 in the United States with a correlation coefficient (R) of 0.537 and weighted average of 5.7%. Similarly, the statistical analysis conducted on geographies consisting of 47,618,884 people shows a significant positive correlation between the proportion of Ottawa and unemployment rate amomg seniors over the age of 65 in the United States with a correlation coefficient (R) of 0.667 and weighted average of 5.3%, a difference of 6.3%.
Unemployment Among Seniors over 65 years Correlation Summary
| Measurement | Immigrants from Central America | Ottawa |
| Minimum | 2.1% | 1.7% |
| Maximum | 30.1% | 33.3% |
| Range | 28.0% | 31.6% |
| Mean | 7.2% | 9.5% |
| Median | 5.9% | 6.3% |
| Interquartile 25% (IQ1) | 5.0% | 4.6% |
| Interquartile 75% (IQ3) | 7.0% | 11.0% |
| Interquartile Range (IQR) | 2.0% | 6.4% |
| Standard Deviation (Sample) | 4.8% | 8.5% |
| Standard Deviation (Population) | 4.8% | 8.3% |
Similar Demographics by Unemployment Among Seniors over 65 years
Demographics Similar to Immigrants from Central America by Unemployment Among Seniors over 65 years
In terms of unemployment among seniors over 65 years, the demographic groups most similar to Immigrants from Central America are Immigrants from Bahamas (5.7%, a difference of 0.12%), Immigrants from El Salvador (5.7%, a difference of 0.18%), Delaware (5.7%, a difference of 0.22%), Vietnamese (5.7%, a difference of 0.43%), and Immigrants from Bangladesh (5.7%, a difference of 0.66%).
| Demographics | Rating | Rank | Unemployment Among Seniors over 65 years |
| Immigrants | Guatemala | 0.0 /100 | #309 | Tragic 5.6% |
| Salvadorans | 0.0 /100 | #310 | Tragic 5.6% |
| Immigrants | Guyana | 0.0 /100 | #311 | Tragic 5.6% |
| Immigrants | Ecuador | 0.0 /100 | #312 | Tragic 5.6% |
| Barbadians | 0.0 /100 | #313 | Tragic 5.6% |
| Delaware | 0.0 /100 | #314 | Tragic 5.7% |
| Immigrants | El Salvador | 0.0 /100 | #315 | Tragic 5.7% |
| Immigrants | Central America | 0.0 /100 | #316 | Tragic 5.7% |
| Immigrants | Bahamas | 0.0 /100 | #317 | Tragic 5.7% |
| Vietnamese | 0.0 /100 | #318 | Tragic 5.7% |
| Immigrants | Bangladesh | 0.0 /100 | #319 | Tragic 5.7% |
| Immigrants | Mexico | 0.0 /100 | #320 | Tragic 5.7% |
| British West Indians | 0.0 /100 | #321 | Tragic 5.8% |
| Natives/Alaskans | 0.0 /100 | #322 | Tragic 5.8% |
| Immigrants | Dominica | 0.0 /100 | #323 | Tragic 5.8% |
Demographics Similar to Ottawa by Unemployment Among Seniors over 65 years
In terms of unemployment among seniors over 65 years, the demographic groups most similar to Ottawa are Peruvian (5.3%, a difference of 0.010%), Colombian (5.3%, a difference of 0.030%), Immigrants from Caribbean (5.3%, a difference of 0.070%), Nigerian (5.3%, a difference of 0.11%), and French Canadian (5.4%, a difference of 0.12%).
| Demographics | Rating | Rank | Unemployment Among Seniors over 65 years |
| Immigrants | Israel | 2.0 /100 | #238 | Tragic 5.3% |
| Immigrants | Senegal | 1.8 /100 | #239 | Tragic 5.3% |
| Immigrants | Trinidad and Tobago | 1.6 /100 | #240 | Tragic 5.3% |
| Apache | 1.3 /100 | #241 | Tragic 5.3% |
| Bahamians | 0.9 /100 | #242 | Tragic 5.3% |
| Nigerians | 0.9 /100 | #243 | Tragic 5.3% |
| Peruvians | 0.8 /100 | #244 | Tragic 5.3% |
| Ottawa | 0.8 /100 | #245 | Tragic 5.3% |
| Colombians | 0.7 /100 | #246 | Tragic 5.3% |
| Immigrants | Caribbean | 0.7 /100 | #247 | Tragic 5.3% |
| French Canadians | 0.7 /100 | #248 | Tragic 5.4% |
| Immigrants | Immigrants | 0.6 /100 | #249 | Tragic 5.4% |
| Ghanaians | 0.6 /100 | #250 | Tragic 5.4% |
| West Indians | 0.6 /100 | #251 | Tragic 5.4% |
| Trinidadians and Tobagonians | 0.6 /100 | #252 | Tragic 5.4% |