Immigrants from Central America vs Immigrants from Czechoslovakia Male Unemployment

COMPARE

Immigrants from Central America
Race
Ancestry
AfghanAfricanAlaska NativeAlaskan AthabascanAlbanianAleutAlsatianAmericanApacheArabArapahoArgentineanArmenianAssyrian/Chaldean/SyriacAustralianAustrianBahamianBangladeshiBarbadianBasqueBelgianBelizeanBermudanBhutaneseBlackfeetBolivianBrazilianBritishBritish West IndianBulgarianBurmeseCajunCambodianCanadianCape VerdeanCarpatho RusynCelticCentral AmericanCentral American IndianCherokeeCheyenneChickasawChileanChineseChippewaChoctawColombianColvilleComancheCosta RicanCreeCreekCroatianCrowCubanCypriotCzechCzechoslovakianDanishDelawareDominicanDutchDutch West IndianEastern EuropeanEcuadorianEgyptianEnglishEstonianEthiopianEuropeanFijianFilipinoFinnishFrenchFrench American IndianFrench CanadianGermanGerman RussianGhanaianGreekGuamanian/ChamorroGuatemalanGuyaneseHaitianHmongHonduranHopiHoumaHungarianIcelanderIndian (Asian)IndonesianInupiatIranianIraqiIrishIroquoisIsraeliItalianJamaicanJapaneseJordanianKenyanKiowaKoreanLaotianLatvianLebaneseLiberianLithuanianLumbeeLuxembourgerMacedonianMalaysianMalteseMarshalleseMenomineeMexicanMexican American IndianMongolianMoroccanNative HawaiianNavajoNepaleseNew ZealanderNicaraguanNigerianNorthern EuropeanNorwegianOkinawanOsageOttawaPaiutePakistaniPalestinianPanamanianParaguayanPennsylvania GermanPeruvianPimaPolishPortuguesePotawatomiPuebloPuerto RicanPuget Sound SalishRomanianRussianSalvadoranSamoanScandinavianScotch-IrishScottishSeminoleSenegaleseSerbianShoshoneSierra LeoneanSiouxSlavicSlovakSloveneSomaliSouth AfricanSouth AmericanSouth American IndianSoviet UnionSpaniardSpanishSpanish AmericanSpanish American IndianSri LankanSubsaharan AfricanSudaneseSwedishSwissSyrianTaiwaneseThaiTlingit-HaidaTohono O'OdhamTonganTrinidadian and TobagonianTsimshianTurkishU.S. Virgin IslanderUgandanUkrainianUruguayanUteVenezuelanVietnameseWelshWest IndianYakamaYaquiYugoslavianYumanYup'ikZimbabwean
Immigration
NonimmigrantsImmigrantsAfghanistanAfricaAlbaniaArgentinaArmeniaAsiaAustraliaAustriaBahamasBangladeshBarbadosBelarusBelgiumBelizeBoliviaBosnia and HerzegovinaBrazilBulgariaBurma/MyanmarCabo VerdeCambodiaCameroonCanadaCaribbeanCentral AmericaChileChinaColombiaCongoCosta RicaCroatiaCubaDenmarkDominicaDominican RepublicEastern AfricaEastern AsiaEastern EuropeEcuadorEgyptEl SalvadorEnglandEritreaEthiopiaEuropeFijiFranceGermanyGhanaGreeceGrenadaGuatemalaGuyanaHaitiHondurasHong KongHungaryIndiaIndonesiaIranIraqIrelandIsraelItalyJamaicaJapanJordanKazakhstanKenyaKoreaKuwaitLaosLatin AmericaLatviaLebanonLiberiaLithuaniaMalaysiaMexicoMicronesiaMiddle AfricaMoldovaMoroccoNepalNetherlandsNicaraguaNigeriaNorth AmericaNorth MacedoniaNorthern AfricaNorthern EuropeNorwayOceaniaPakistanPanamaPeruPhilippinesPolandPortugalRomaniaRussiaSaudi ArabiaScotlandSenegalSerbiaSierra LeoneSingaporeSomaliaSouth AfricaSouth AmericaSouth Central AsiaSouth Eastern AsiaSouthern EuropeSpainSri LankaSt. Vincent and the GrenadinesSudanSwedenSwitzerlandSyriaTaiwanThailandTrinidad and TobagoTurkeyUgandaUkraineUruguayUzbekistanVenezuelaVietnamWest IndiesWestern AfricaWestern AsiaWestern EuropeYemenZaireZimbabweAzores
Immigrants from Czechoslovakia
Race
Ancestry
AfghanAfricanAlaska NativeAlaskan AthabascanAlbanianAleutAlsatianAmericanApacheArabArapahoArgentineanArmenianAssyrian/Chaldean/SyriacAustralianAustrianBahamianBangladeshiBarbadianBasqueBelgianBelizeanBermudanBhutaneseBlackfeetBolivianBrazilianBritishBritish West IndianBulgarianBurmeseCajunCambodianCanadianCape VerdeanCarpatho RusynCelticCentral AmericanCentral American IndianCherokeeCheyenneChickasawChileanChineseChippewaChoctawColombianColvilleComancheCosta RicanCreeCreekCroatianCrowCubanCypriotCzechCzechoslovakianDanishDelawareDominicanDutchDutch West IndianEastern EuropeanEcuadorianEgyptianEnglishEstonianEthiopianEuropeanFijianFilipinoFinnishFrenchFrench American IndianFrench CanadianGermanGerman RussianGhanaianGreekGuamanian/ChamorroGuatemalanGuyaneseHaitianHmongHonduranHopiHoumaHungarianIcelanderIndian (Asian)IndonesianInupiatIranianIraqiIrishIroquoisIsraeliItalianJamaicanJapaneseJordanianKenyanKiowaKoreanLaotianLatvianLebaneseLiberianLithuanianLumbeeLuxembourgerMacedonianMalaysianMalteseMarshalleseMenomineeMexicanMexican American IndianMongolianMoroccanNative HawaiianNavajoNepaleseNew ZealanderNicaraguanNigerianNorthern EuropeanNorwegianOkinawanOsageOttawaPaiutePakistaniPalestinianPanamanianParaguayanPennsylvania GermanPeruvianPimaPolishPortuguesePotawatomiPuebloPuerto RicanPuget Sound SalishRomanianRussianSalvadoranSamoanScandinavianScotch-IrishScottishSeminoleSenegaleseSerbianShoshoneSierra LeoneanSiouxSlavicSlovakSloveneSomaliSouth AfricanSouth AmericanSouth American IndianSoviet UnionSpaniardSpanishSpanish AmericanSpanish American IndianSri LankanSubsaharan AfricanSudaneseSwedishSwissSyrianTaiwaneseThaiTlingit-HaidaTohono O'OdhamTonganTrinidadian and TobagonianTsimshianTurkishU.S. Virgin IslanderUgandanUkrainianUruguayanUteVenezuelanVietnameseWelshWest IndianYakamaYaquiYugoslavianYumanYup'ikZimbabwean
Immigration
NonimmigrantsImmigrantsAfghanistanAfricaAlbaniaArgentinaArmeniaAsiaAustraliaAustriaBahamasBangladeshBarbadosBelarusBelgiumBelizeBoliviaBosnia and HerzegovinaBrazilBulgariaBurma/MyanmarCabo VerdeCambodiaCameroonCanadaCaribbeanChileChinaColombiaCongoCosta RicaCroatiaCubaCzechoslovakiaDenmarkDominicaDominican RepublicEastern AfricaEastern AsiaEastern EuropeEcuadorEgyptEl SalvadorEnglandEritreaEthiopiaEuropeFijiFranceGermanyGhanaGreeceGrenadaGuatemalaGuyanaHaitiHondurasHong KongHungaryIndiaIndonesiaIranIraqIrelandIsraelItalyJamaicaJapanJordanKazakhstanKenyaKoreaKuwaitLaosLatin AmericaLatviaLebanonLiberiaLithuaniaMalaysiaMexicoMicronesiaMiddle AfricaMoldovaMoroccoNepalNetherlandsNicaraguaNigeriaNorth AmericaNorth MacedoniaNorthern AfricaNorthern EuropeNorwayOceaniaPakistanPanamaPeruPhilippinesPolandPortugalRomaniaRussiaSaudi ArabiaScotlandSenegalSerbiaSierra LeoneSingaporeSomaliaSouth AfricaSouth AmericaSouth Central AsiaSouth Eastern AsiaSouthern EuropeSpainSri LankaSt. Vincent and the GrenadinesSudanSwedenSwitzerlandSyriaTaiwanThailandTrinidad and TobagoTurkeyUgandaUkraineUruguayUzbekistanVenezuelaVietnamWest IndiesWestern AfricaWestern AsiaWestern EuropeYemenZaireZimbabweAzores
Male Unemployment
Income
Poverty
Unemployment
Labor Participation
Family Structure
Vehicle Availability
Education Level
Disability

Male Unemployment Comparison

Immigrants from Central America

Immigrants from Czechoslovakia

Tragic
Exceptional
5.8%
MALE UNEMPLOYMENT
0.1/ 100
METRIC RATING
260th/ 347
METRIC RANK
5.1%
MALE UNEMPLOYMENT
91.7/ 100
METRIC RATING
105th/ 347
METRIC RANK

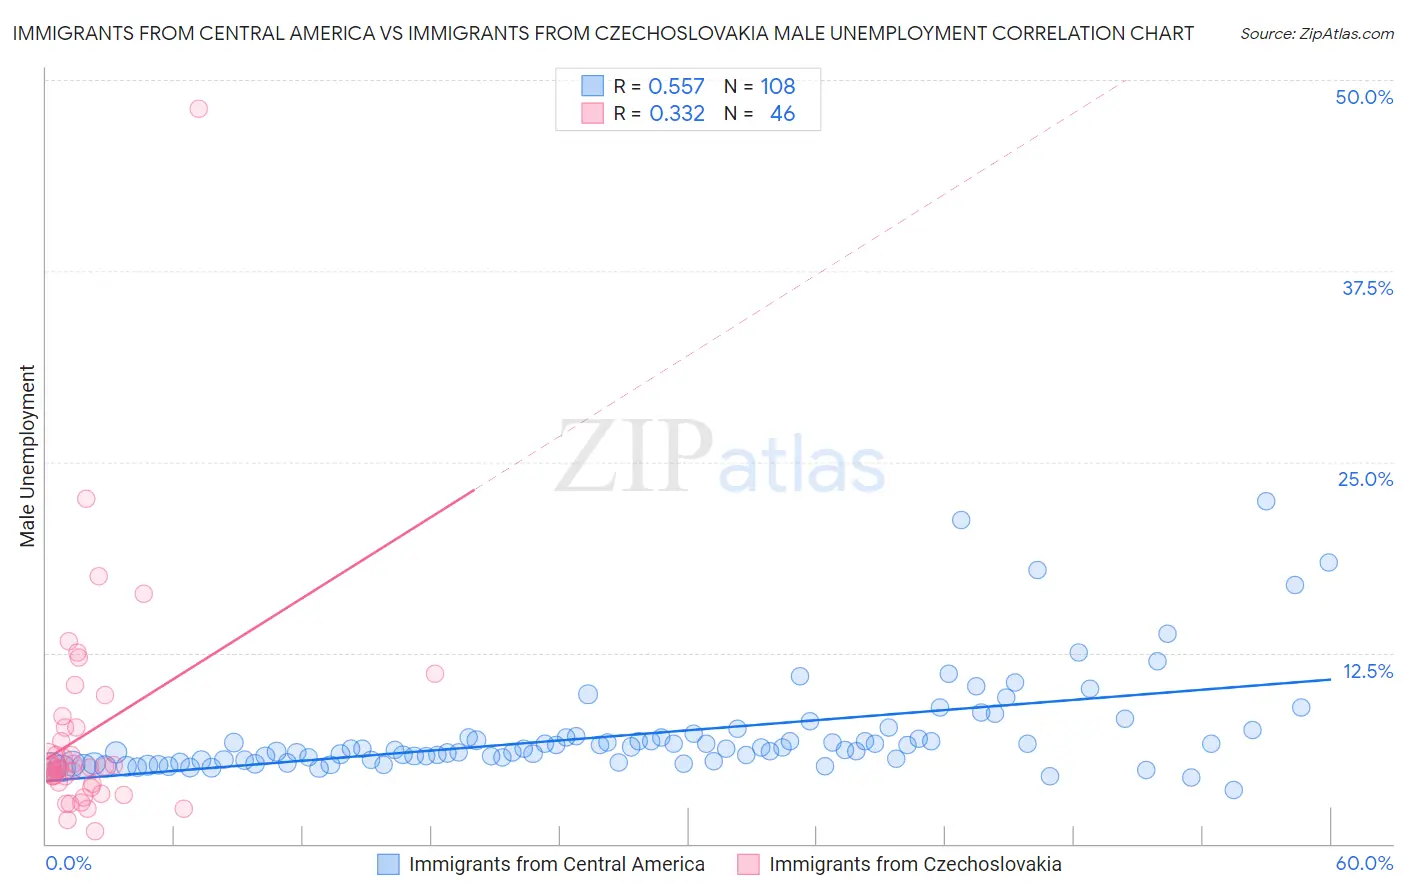
Immigrants from Central America vs Immigrants from Czechoslovakia Male Unemployment Correlation Chart

The statistical analysis conducted on geographies consisting of 529,817,546 people shows a substantial positive correlation between the proportion of Immigrants from Central America and unemployment rate among males in the United States with a correlation coefficient (R) of 0.557 and weighted average of 5.8%. Similarly, the statistical analysis conducted on geographies consisting of 195,196,064 people shows a mild positive correlation between the proportion of Immigrants from Czechoslovakia and unemployment rate among males in the United States with a correlation coefficient (R) of 0.332 and weighted average of 5.1%, a difference of 14.0%.
Immigrants from Central America vs Immigrants from Czechoslovakia Male Unemployment

Male Unemployment Correlation Summary

MeasurementImmigrants from Central AmericaImmigrants from Czechoslovakia
Minimum3.5%0.80%
Maximum22.4%48.1%
Range18.9%47.3%
Mean7.2%7.3%
Median6.2%5.0%
Interquartile 25% (IQ1)5.4%3.9%
Interquartile 75% (IQ3)7.0%7.6%
Interquartile Range (IQR)1.6%3.7%
Standard Deviation (Sample)3.3%7.6%
Standard Deviation (Population)3.2%7.5%

Similar Demographics by Male Unemployment

Demographics Similar to Immigrants from Central America by Male Unemployment

In terms of male unemployment, the demographic groups most similar to Immigrants from Central America are Cajun (5.8%, a difference of 0.060%), Liberian (5.8%, a difference of 0.18%), Dutch West Indian (5.8%, a difference of 0.21%), Hispanic or Latino (5.8%, a difference of 0.35%), and Comanche (5.8%, a difference of 0.52%).
DemographicsRating | RankMale Unemployment
Mexican American Indians
0.2
/100
|
#253
Tragic
5.8%
Japanese
0.2
/100
|
#254
Tragic
5.8%
Kiowa
0.2
/100
|
#255
Tragic
5.8%
Comanche
0.2
/100
|
#256
Tragic
5.8%
Hispanics or Latinos
0.1
/100
|
#257
Tragic
5.8%
Dutch West Indians
0.1
/100
|
#258
Tragic
5.8%
Cajuns
0.1
/100
|
#259
Tragic
5.8%
Immigrants | Central America
0.1
/100
|
#260
Tragic
5.8%
Liberians
0.1
/100
|
#261
Tragic
5.8%
Immigrants | Portugal
0.1
/100
|
#262
Tragic
5.9%
Immigrants | Latin America
0.1
/100
|
#263
Tragic
5.9%
Immigrants | Mexico
0.0
/100
|
#264
Tragic
5.9%
French American Indians
0.0
/100
|
#265
Tragic
5.9%
Bahamians
0.0
/100
|
#266
Tragic
5.9%
Nigerians
0.0
/100
|
#267
Tragic
5.9%

Demographics Similar to Immigrants from Czechoslovakia by Male Unemployment

In terms of male unemployment, the demographic groups most similar to Immigrants from Czechoslovakia are Immigrants from Chile (5.1%, a difference of 0.010%), Immigrants from Jordan (5.1%, a difference of 0.040%), Immigrants from Ethiopia (5.1%, a difference of 0.040%), Ethiopian (5.1%, a difference of 0.080%), and Immigrants from Nicaragua (5.1%, a difference of 0.090%).
DemographicsRating | RankMale Unemployment
Immigrants | Kuwait
93.3
/100
|
#98
Exceptional
5.1%
Uruguayans
93.0
/100
|
#99
Exceptional
5.1%
Russians
92.9
/100
|
#100
Exceptional
5.1%
German Russians
92.7
/100
|
#101
Exceptional
5.1%
Immigrants | France
92.7
/100
|
#102
Exceptional
5.1%
Immigrants | Jordan
91.9
/100
|
#103
Exceptional
5.1%
Immigrants | Chile
91.8
/100
|
#104
Exceptional
5.1%
Immigrants | Czechoslovakia
91.7
/100
|
#105
Exceptional
5.1%
Immigrants | Ethiopia
91.5
/100
|
#106
Exceptional
5.1%
Ethiopians
91.3
/100
|
#107
Exceptional
5.1%
Immigrants | Nicaragua
91.2
/100
|
#108
Exceptional
5.1%
Immigrants | Pakistan
90.9
/100
|
#109
Exceptional
5.1%
Immigrants | England
90.8
/100
|
#110
Exceptional
5.1%
Immigrants | Eastern Asia
90.8
/100
|
#111
Exceptional
5.1%
Immigrants | Moldova
90.3
/100
|
#112
Exceptional
5.1%