Immigrants from Caribbean vs Immigrants from Hungary Unemployment Among Youth under 25 years

COMPARE

Immigrants from Caribbean
Race
Ancestry
AfghanAfricanAlaska NativeAlaskan AthabascanAlbanianAleutAlsatianAmericanApacheArabArapahoArgentineanArmenianAssyrian/Chaldean/SyriacAustralianAustrianBahamianBangladeshiBarbadianBasqueBelgianBelizeanBermudanBhutaneseBlackfeetBolivianBrazilianBritishBritish West IndianBulgarianBurmeseCajunCambodianCanadianCape VerdeanCarpatho RusynCelticCentral AmericanCentral American IndianCherokeeCheyenneChickasawChileanChineseChippewaChoctawColombianColvilleComancheCosta RicanCreeCreekCroatianCrowCubanCypriotCzechCzechoslovakianDanishDelawareDominicanDutchDutch West IndianEastern EuropeanEcuadorianEgyptianEnglishEstonianEthiopianEuropeanFijianFilipinoFinnishFrenchFrench American IndianFrench CanadianGermanGerman RussianGhanaianGreekGuamanian/ChamorroGuatemalanGuyaneseHaitianHmongHonduranHopiHoumaHungarianIcelanderIndian (Asian)IndonesianInupiatIranianIraqiIrishIroquoisIsraeliItalianJamaicanJapaneseJordanianKenyanKiowaKoreanLaotianLatvianLebaneseLiberianLithuanianLumbeeLuxembourgerMacedonianMalaysianMalteseMarshalleseMenomineeMexicanMexican American IndianMongolianMoroccanNative HawaiianNavajoNepaleseNew ZealanderNicaraguanNigerianNorthern EuropeanNorwegianOkinawanOsageOttawaPaiutePakistaniPalestinianPanamanianParaguayanPennsylvania GermanPeruvianPimaPolishPortuguesePotawatomiPuebloPuerto RicanPuget Sound SalishRomanianRussianSalvadoranSamoanScandinavianScotch-IrishScottishSeminoleSenegaleseSerbianShoshoneSierra LeoneanSiouxSlavicSlovakSloveneSomaliSouth AfricanSouth AmericanSouth American IndianSoviet UnionSpaniardSpanishSpanish AmericanSpanish American IndianSri LankanSubsaharan AfricanSudaneseSwedishSwissSyrianTaiwaneseThaiTlingit-HaidaTohono O'OdhamTonganTrinidadian and TobagonianTsimshianTurkishU.S. Virgin IslanderUgandanUkrainianUruguayanUteVenezuelanVietnameseWelshWest IndianYakamaYaquiYugoslavianYumanYup'ikZimbabwean
Immigration
NonimmigrantsImmigrantsAfghanistanAfricaAlbaniaArgentinaArmeniaAsiaAustraliaAustriaBahamasBangladeshBarbadosBelarusBelgiumBelizeBoliviaBosnia and HerzegovinaBrazilBulgariaBurma/MyanmarCabo VerdeCambodiaCameroonCanadaCaribbeanCentral AmericaChileChinaColombiaCongoCosta RicaCroatiaCubaCzechoslovakiaDenmarkDominicaDominican RepublicEastern AfricaEastern AsiaEastern EuropeEcuadorEgyptEl SalvadorEnglandEritreaEthiopiaEuropeFijiFranceGermanyGhanaGreeceGrenadaGuatemalaGuyanaHaitiHondurasHong KongIndiaIndonesiaIranIraqIrelandIsraelItalyJamaicaJapanJordanKazakhstanKenyaKoreaKuwaitLaosLatin AmericaLatviaLebanonLiberiaLithuaniaMalaysiaMexicoMicronesiaMiddle AfricaMoldovaMoroccoNepalNetherlandsNicaraguaNigeriaNorth AmericaNorth MacedoniaNorthern AfricaNorthern EuropeNorwayOceaniaPakistanPanamaPeruPhilippinesPolandPortugalRomaniaRussiaSaudi ArabiaScotlandSenegalSerbiaSierra LeoneSingaporeSomaliaSouth AfricaSouth AmericaSouth Central AsiaSouth Eastern AsiaSouthern EuropeSpainSri LankaSt. Vincent and the GrenadinesSudanSwedenSwitzerlandSyriaTaiwanThailandTrinidad and TobagoTurkeyUgandaUkraineUruguayUzbekistanVenezuelaVietnamWest IndiesWestern AfricaWestern AsiaWestern EuropeYemenZaireZimbabweAzores
Immigrants from Hungary
Race
Ancestry
AfghanAfricanAlaska NativeAlaskan AthabascanAlbanianAleutAlsatianAmericanApacheArabArapahoArgentineanArmenianAssyrian/Chaldean/SyriacAustralianAustrianBahamianBangladeshiBarbadianBasqueBelgianBelizeanBermudanBhutaneseBlackfeetBolivianBrazilianBritishBritish West IndianBulgarianBurmeseCajunCambodianCanadianCape VerdeanCarpatho RusynCelticCentral AmericanCentral American IndianCherokeeCheyenneChickasawChileanChineseChippewaChoctawColombianColvilleComancheCosta RicanCreeCreekCroatianCrowCubanCypriotCzechCzechoslovakianDanishDelawareDominicanDutchDutch West IndianEastern EuropeanEcuadorianEgyptianEnglishEstonianEthiopianEuropeanFijianFilipinoFinnishFrenchFrench American IndianFrench CanadianGermanGerman RussianGhanaianGreekGuamanian/ChamorroGuatemalanGuyaneseHaitianHmongHonduranHopiHoumaHungarianIcelanderIndian (Asian)IndonesianInupiatIranianIraqiIrishIroquoisIsraeliItalianJamaicanJapaneseJordanianKenyanKiowaKoreanLaotianLatvianLebaneseLiberianLithuanianLumbeeLuxembourgerMacedonianMalaysianMalteseMarshalleseMenomineeMexicanMexican American IndianMongolianMoroccanNative HawaiianNavajoNepaleseNew ZealanderNicaraguanNigerianNorthern EuropeanNorwegianOkinawanOsageOttawaPaiutePakistaniPalestinianPanamanianParaguayanPennsylvania GermanPeruvianPimaPolishPortuguesePotawatomiPuebloPuerto RicanPuget Sound SalishRomanianRussianSalvadoranSamoanScandinavianScotch-IrishScottishSeminoleSenegaleseSerbianShoshoneSierra LeoneanSiouxSlavicSlovakSloveneSomaliSouth AfricanSouth AmericanSouth American IndianSoviet UnionSpaniardSpanishSpanish AmericanSpanish American IndianSri LankanSubsaharan AfricanSudaneseSwedishSwissSyrianTaiwaneseThaiTlingit-HaidaTohono O'OdhamTonganTrinidadian and TobagonianTsimshianTurkishU.S. Virgin IslanderUgandanUkrainianUruguayanUteVenezuelanVietnameseWelshWest IndianYakamaYaquiYugoslavianYumanYup'ikZimbabwean
Immigration
NonimmigrantsImmigrantsAfghanistanAfricaAlbaniaArgentinaArmeniaAsiaAustraliaAustriaBahamasBangladeshBarbadosBelarusBelgiumBelizeBoliviaBosnia and HerzegovinaBrazilBulgariaBurma/MyanmarCabo VerdeCambodiaCameroonCanadaCentral AmericaChileChinaColombiaCongoCosta RicaCroatiaCubaCzechoslovakiaDenmarkDominicaDominican RepublicEastern AfricaEastern AsiaEastern EuropeEcuadorEgyptEl SalvadorEnglandEritreaEthiopiaEuropeFijiFranceGermanyGhanaGreeceGrenadaGuatemalaGuyanaHaitiHondurasHong KongHungaryIndiaIndonesiaIranIraqIrelandIsraelItalyJamaicaJapanJordanKazakhstanKenyaKoreaKuwaitLaosLatin AmericaLatviaLebanonLiberiaLithuaniaMalaysiaMexicoMicronesiaMiddle AfricaMoldovaMoroccoNepalNetherlandsNicaraguaNigeriaNorth AmericaNorth MacedoniaNorthern AfricaNorthern EuropeNorwayOceaniaPakistanPanamaPeruPhilippinesPolandPortugalRomaniaRussiaSaudi ArabiaScotlandSenegalSerbiaSierra LeoneSingaporeSomaliaSouth AfricaSouth AmericaSouth Central AsiaSouth Eastern AsiaSouthern EuropeSpainSri LankaSt. Vincent and the GrenadinesSudanSwedenSwitzerlandSyriaTaiwanThailandTrinidad and TobagoTurkeyUgandaUkraineUruguayUzbekistanVenezuelaVietnamWest IndiesWestern AfricaWestern AsiaWestern EuropeYemenZaireZimbabweAzores
Unemployment Among Youth under 25 years
Income
Poverty
Unemployment
Labor Participation
Family Structure
Vehicle Availability
Education Level
Disability

Unemployment Among Youth under 25 years Comparison

Immigrants from Caribbean

Immigrants from Hungary

Tragic
Excellent
13.5%
UNEMPLOYMENT AMONG YOUTH UNDER 25 YEARS
0.0/ 100
METRIC RATING
294th/ 347
METRIC RANK
11.4%
UNEMPLOYMENT AMONG YOUTH UNDER 25 YEARS
86.0/ 100
METRIC RATING
128th/ 347
METRIC RANK

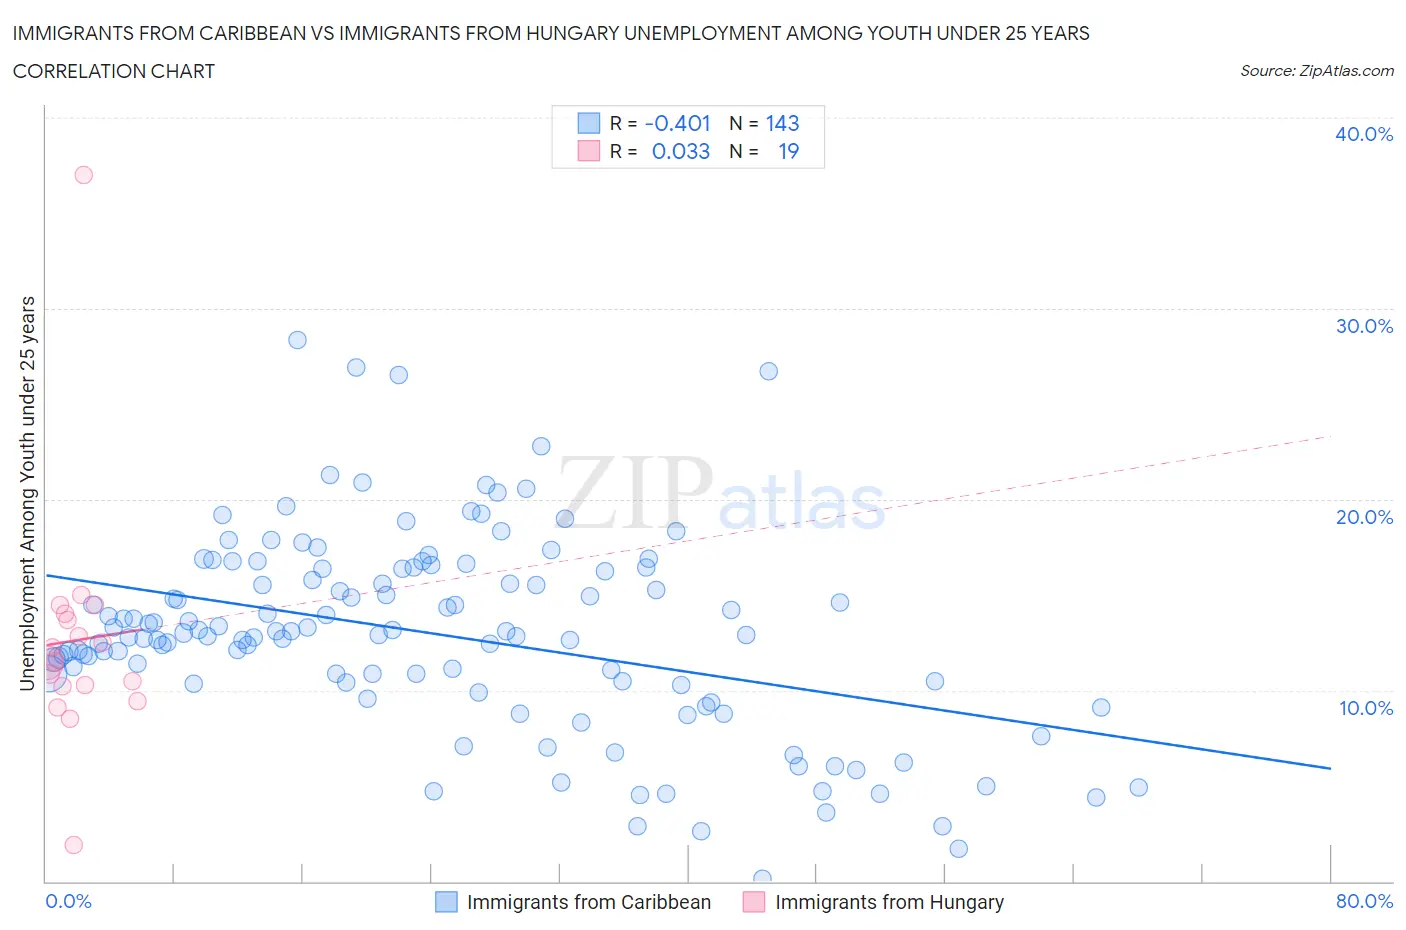
Immigrants from Caribbean vs Immigrants from Hungary Unemployment Among Youth under 25 years Correlation Chart

The statistical analysis conducted on geographies consisting of 442,870,583 people shows a moderate negative correlation between the proportion of Immigrants from Caribbean and unemployment rate among youth under the age of 25 in the United States with a correlation coefficient (R) of -0.401 and weighted average of 13.5%. Similarly, the statistical analysis conducted on geographies consisting of 194,362,446 people shows no correlation between the proportion of Immigrants from Hungary and unemployment rate among youth under the age of 25 in the United States with a correlation coefficient (R) of 0.033 and weighted average of 11.4%, a difference of 18.5%.
Immigrants from Caribbean vs Immigrants from Hungary Unemployment Among Youth under 25 years

Unemployment Among Youth under 25 years Correlation Summary

MeasurementImmigrants from CaribbeanImmigrants from Hungary
Minimum0.10%1.9%
Maximum28.3%37.0%
Range28.2%35.1%
Mean12.9%12.6%
Median12.9%11.5%
Interquartile 25% (IQ1)10.4%10.2%
Interquartile 75% (IQ3)16.4%14.0%
Interquartile Range (IQR)6.0%3.8%
Standard Deviation (Sample)5.1%6.6%
Standard Deviation (Population)5.1%6.4%

Similar Demographics by Unemployment Among Youth under 25 years

Demographics Similar to Immigrants from Caribbean by Unemployment Among Youth under 25 years

In terms of unemployment among youth under 25 years, the demographic groups most similar to Immigrants from Caribbean are Spanish American Indian (13.5%, a difference of 0.16%), Chippewa (13.5%, a difference of 0.24%), Senegalese (13.5%, a difference of 0.26%), Central American Indian (13.5%, a difference of 0.27%), and Apache (13.5%, a difference of 0.31%).
DemographicsRating | RankUnemployment Among Youth under 25 years
Ecuadorians
0.0
/100
|
#287
Tragic
13.3%
Immigrants | Western Africa
0.0
/100
|
#288
Tragic
13.4%
Immigrants | Ghana
0.0
/100
|
#289
Tragic
13.4%
Immigrants | Ecuador
0.0
/100
|
#290
Tragic
13.4%
Apache
0.0
/100
|
#291
Tragic
13.5%
Central American Indians
0.0
/100
|
#292
Tragic
13.5%
Spanish American Indians
0.0
/100
|
#293
Tragic
13.5%
Immigrants | Caribbean
0.0
/100
|
#294
Tragic
13.5%
Chippewa
0.0
/100
|
#295
Tragic
13.5%
Senegalese
0.0
/100
|
#296
Tragic
13.5%
U.S. Virgin Islanders
0.0
/100
|
#297
Tragic
13.6%
Shoshone
0.0
/100
|
#298
Tragic
13.7%
Tohono O'odham
0.0
/100
|
#299
Tragic
13.8%
Immigrants | Cabo Verde
0.0
/100
|
#300
Tragic
13.8%
Immigrants | Senegal
0.0
/100
|
#301
Tragic
13.8%

Demographics Similar to Immigrants from Hungary by Unemployment Among Youth under 25 years

In terms of unemployment among youth under 25 years, the demographic groups most similar to Immigrants from Hungary are Greek (11.4%, a difference of 0.020%), Turkish (11.4%, a difference of 0.020%), Hungarian (11.4%, a difference of 0.030%), Canadian (11.4%, a difference of 0.050%), and Immigrants from Argentina (11.4%, a difference of 0.10%).
DemographicsRating | RankUnemployment Among Youth under 25 years
Slovaks
88.9
/100
|
#121
Excellent
11.4%
Immigrants | Micronesia
88.1
/100
|
#122
Excellent
11.4%
Basques
87.8
/100
|
#123
Excellent
11.4%
Italians
87.2
/100
|
#124
Excellent
11.4%
Immigrants | Argentina
87.2
/100
|
#125
Excellent
11.4%
Canadians
86.6
/100
|
#126
Excellent
11.4%
Greeks
86.2
/100
|
#127
Excellent
11.4%
Immigrants | Hungary
86.0
/100
|
#128
Excellent
11.4%
Turks
85.8
/100
|
#129
Excellent
11.4%
Hungarians
85.7
/100
|
#130
Excellent
11.4%
Immigrants | Spain
84.6
/100
|
#131
Excellent
11.4%
Ethiopians
83.2
/100
|
#132
Excellent
11.4%
Lebanese
83.1
/100
|
#133
Excellent
11.4%
Immigrants | Chile
80.4
/100
|
#134
Excellent
11.4%
Immigrants | Oceania
80.2
/100
|
#135
Excellent
11.4%