Immigrants from Caribbean vs Immigrants from Europe Unemployment Among Ages 16 to 19 years

COMPARE

Immigrants from Caribbean
Race
Ancestry
AfghanAfricanAlaska NativeAlaskan AthabascanAlbanianAleutAlsatianAmericanApacheArabArapahoArgentineanArmenianAssyrian/Chaldean/SyriacAustralianAustrianBahamianBangladeshiBarbadianBasqueBelgianBelizeanBermudanBhutaneseBlackfeetBolivianBrazilianBritishBritish West IndianBulgarianBurmeseCajunCambodianCanadianCape VerdeanCarpatho RusynCelticCentral AmericanCentral American IndianCherokeeCheyenneChickasawChileanChineseChippewaChoctawColombianColvilleComancheCosta RicanCreeCreekCroatianCrowCubanCypriotCzechCzechoslovakianDanishDelawareDominicanDutchDutch West IndianEastern EuropeanEcuadorianEgyptianEnglishEstonianEthiopianEuropeanFijianFilipinoFinnishFrenchFrench American IndianFrench CanadianGermanGerman RussianGhanaianGreekGuamanian/ChamorroGuatemalanGuyaneseHaitianHmongHonduranHopiHoumaHungarianIcelanderIndian (Asian)IndonesianInupiatIranianIraqiIrishIroquoisIsraeliItalianJamaicanJapaneseJordanianKenyanKiowaKoreanLaotianLatvianLebaneseLiberianLithuanianLumbeeLuxembourgerMacedonianMalaysianMalteseMarshalleseMenomineeMexicanMexican American IndianMongolianMoroccanNative HawaiianNavajoNepaleseNew ZealanderNicaraguanNigerianNorthern EuropeanNorwegianOkinawanOsageOttawaPaiutePakistaniPalestinianPanamanianParaguayanPennsylvania GermanPeruvianPimaPolishPortuguesePotawatomiPuebloPuerto RicanPuget Sound SalishRomanianRussianSalvadoranSamoanScandinavianScotch-IrishScottishSeminoleSenegaleseSerbianShoshoneSierra LeoneanSiouxSlavicSlovakSloveneSomaliSouth AfricanSouth AmericanSouth American IndianSoviet UnionSpaniardSpanishSpanish AmericanSpanish American IndianSri LankanSubsaharan AfricanSudaneseSwedishSwissSyrianTaiwaneseThaiTlingit-HaidaTohono O'OdhamTonganTrinidadian and TobagonianTsimshianTurkishU.S. Virgin IslanderUgandanUkrainianUruguayanUteVenezuelanVietnameseWelshWest IndianYakamaYaquiYugoslavianYumanYup'ikZimbabwean
Immigration
NonimmigrantsImmigrantsAfghanistanAfricaAlbaniaArgentinaArmeniaAsiaAustraliaAustriaBahamasBangladeshBarbadosBelarusBelgiumBelizeBoliviaBosnia and HerzegovinaBrazilBulgariaBurma/MyanmarCabo VerdeCambodiaCameroonCanadaCaribbeanCentral AmericaChileChinaColombiaCongoCosta RicaCroatiaCubaCzechoslovakiaDenmarkDominicaDominican RepublicEastern AfricaEastern AsiaEastern EuropeEcuadorEgyptEl SalvadorEnglandEritreaEthiopiaFijiFranceGermanyGhanaGreeceGrenadaGuatemalaGuyanaHaitiHondurasHong KongHungaryIndiaIndonesiaIranIraqIrelandIsraelItalyJamaicaJapanJordanKazakhstanKenyaKoreaKuwaitLaosLatin AmericaLatviaLebanonLiberiaLithuaniaMalaysiaMexicoMicronesiaMiddle AfricaMoldovaMoroccoNepalNetherlandsNicaraguaNigeriaNorth AmericaNorth MacedoniaNorthern AfricaNorthern EuropeNorwayOceaniaPakistanPanamaPeruPhilippinesPolandPortugalRomaniaRussiaSaudi ArabiaScotlandSenegalSerbiaSierra LeoneSingaporeSomaliaSouth AfricaSouth AmericaSouth Central AsiaSouth Eastern AsiaSouthern EuropeSpainSri LankaSt. Vincent and the GrenadinesSudanSwedenSwitzerlandSyriaTaiwanThailandTrinidad and TobagoTurkeyUgandaUkraineUruguayUzbekistanVenezuelaVietnamWest IndiesWestern AfricaWestern AsiaWestern EuropeYemenZaireZimbabweAzores
Immigrants from Europe
Race
Ancestry
AfghanAfricanAlaska NativeAlaskan AthabascanAlbanianAleutAlsatianAmericanApacheArabArapahoArgentineanArmenianAssyrian/Chaldean/SyriacAustralianAustrianBahamianBangladeshiBarbadianBasqueBelgianBelizeanBermudanBhutaneseBlackfeetBolivianBrazilianBritishBritish West IndianBulgarianBurmeseCajunCambodianCanadianCape VerdeanCarpatho RusynCelticCentral AmericanCentral American IndianCherokeeCheyenneChickasawChileanChineseChippewaChoctawColombianColvilleComancheCosta RicanCreeCreekCroatianCrowCubanCypriotCzechCzechoslovakianDanishDelawareDominicanDutchDutch West IndianEastern EuropeanEcuadorianEgyptianEnglishEstonianEthiopianEuropeanFijianFilipinoFinnishFrenchFrench American IndianFrench CanadianGermanGerman RussianGhanaianGreekGuamanian/ChamorroGuatemalanGuyaneseHaitianHmongHonduranHopiHoumaHungarianIcelanderIndian (Asian)IndonesianInupiatIranianIraqiIrishIroquoisIsraeliItalianJamaicanJapaneseJordanianKenyanKiowaKoreanLaotianLatvianLebaneseLiberianLithuanianLumbeeLuxembourgerMacedonianMalaysianMalteseMarshalleseMenomineeMexicanMexican American IndianMongolianMoroccanNative HawaiianNavajoNepaleseNew ZealanderNicaraguanNigerianNorthern EuropeanNorwegianOkinawanOsageOttawaPaiutePakistaniPalestinianPanamanianParaguayanPennsylvania GermanPeruvianPimaPolishPortuguesePotawatomiPuebloPuerto RicanPuget Sound SalishRomanianRussianSalvadoranSamoanScandinavianScotch-IrishScottishSeminoleSenegaleseSerbianShoshoneSierra LeoneanSiouxSlavicSlovakSloveneSomaliSouth AfricanSouth AmericanSouth American IndianSoviet UnionSpaniardSpanishSpanish AmericanSpanish American IndianSri LankanSubsaharan AfricanSudaneseSwedishSwissSyrianTaiwaneseThaiTlingit-HaidaTohono O'OdhamTonganTrinidadian and TobagonianTsimshianTurkishU.S. Virgin IslanderUgandanUkrainianUruguayanUteVenezuelanVietnameseWelshWest IndianYakamaYaquiYugoslavianYumanYup'ikZimbabwean
Immigration
NonimmigrantsImmigrantsAfghanistanAfricaAlbaniaArgentinaArmeniaAsiaAustraliaAustriaBahamasBangladeshBarbadosBelarusBelgiumBelizeBoliviaBosnia and HerzegovinaBrazilBulgariaBurma/MyanmarCabo VerdeCambodiaCameroonCanadaCentral AmericaChileChinaColombiaCongoCosta RicaCroatiaCubaCzechoslovakiaDenmarkDominicaDominican RepublicEastern AfricaEastern AsiaEastern EuropeEcuadorEgyptEl SalvadorEnglandEritreaEthiopiaEuropeFijiFranceGermanyGhanaGreeceGrenadaGuatemalaGuyanaHaitiHondurasHong KongHungaryIndiaIndonesiaIranIraqIrelandIsraelItalyJamaicaJapanJordanKazakhstanKenyaKoreaKuwaitLaosLatin AmericaLatviaLebanonLiberiaLithuaniaMalaysiaMexicoMicronesiaMiddle AfricaMoldovaMoroccoNepalNetherlandsNicaraguaNigeriaNorth AmericaNorth MacedoniaNorthern AfricaNorthern EuropeNorwayOceaniaPakistanPanamaPeruPhilippinesPolandPortugalRomaniaRussiaSaudi ArabiaScotlandSenegalSerbiaSierra LeoneSingaporeSomaliaSouth AfricaSouth AmericaSouth Central AsiaSouth Eastern AsiaSouthern EuropeSpainSri LankaSt. Vincent and the GrenadinesSudanSwedenSwitzerlandSyriaTaiwanThailandTrinidad and TobagoTurkeyUgandaUkraineUruguayUzbekistanVenezuelaVietnamWest IndiesWestern AfricaWestern AsiaWestern EuropeYemenZaireZimbabweAzores
Unemployment Among Ages 16 to 19 years
Income
Poverty
Unemployment
Labor Participation
Family Structure
Vehicle Availability
Education Level
Disability

Unemployment Among Ages 16 to 19 years Comparison

Immigrants from Caribbean

Immigrants from Europe

Tragic
Average
20.9%
UNEMPLOYMENT AMONG AGES 16 TO 19 YEARS
0.0/ 100
METRIC RATING
302nd/ 347
METRIC RANK
17.6%
UNEMPLOYMENT AMONG AGES 16 TO 19 YEARS
41.8/ 100
METRIC RATING
189th/ 347
METRIC RANK

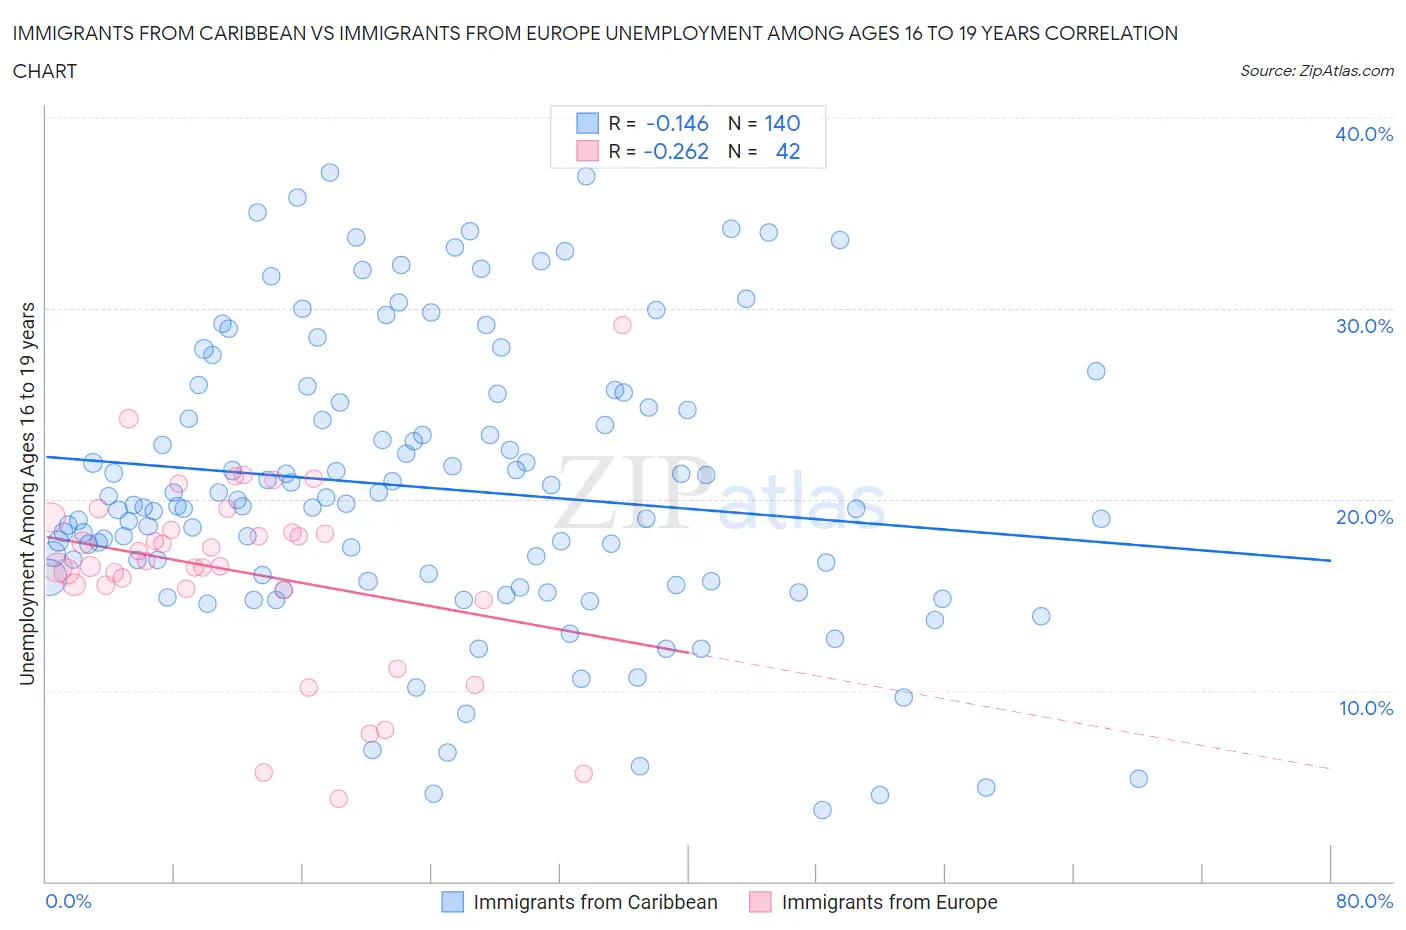
Immigrants from Caribbean vs Immigrants from Europe Unemployment Among Ages 16 to 19 years Correlation Chart

The statistical analysis conducted on geographies consisting of 422,539,513 people shows a poor negative correlation between the proportion of Immigrants from Caribbean and unemployment rate among population between the ages 16 and 19 in the United States with a correlation coefficient (R) of -0.146 and weighted average of 20.9%. Similarly, the statistical analysis conducted on geographies consisting of 496,023,706 people shows a weak negative correlation between the proportion of Immigrants from Europe and unemployment rate among population between the ages 16 and 19 in the United States with a correlation coefficient (R) of -0.262 and weighted average of 17.6%, a difference of 18.4%.
Immigrants from Caribbean vs Immigrants from Europe Unemployment Among Ages 16 to 19 years

Unemployment Among Ages 16 to 19 years Correlation Summary

MeasurementImmigrants from CaribbeanImmigrants from Europe
Minimum3.7%4.3%
Maximum37.1%29.1%
Range33.4%24.8%
Mean20.6%16.2%
Median19.7%16.6%
Interquartile 25% (IQ1)15.8%15.3%
Interquartile 75% (IQ3)25.3%18.4%
Interquartile Range (IQR)9.5%3.1%
Standard Deviation (Sample)7.4%5.0%
Standard Deviation (Population)7.4%4.9%

Similar Demographics by Unemployment Among Ages 16 to 19 years

Demographics Similar to Immigrants from Caribbean by Unemployment Among Ages 16 to 19 years

In terms of unemployment among ages 16 to 19 years, the demographic groups most similar to Immigrants from Caribbean are Immigrants from Ecuador (20.9%, a difference of 0.11%), Senegalese (21.0%, a difference of 0.38%), Aleut (21.2%, a difference of 1.2%), Immigrants from Senegal (21.2%, a difference of 1.4%), and Ecuadorian (20.5%, a difference of 1.7%).
DemographicsRating | RankUnemployment Among Ages 16 to 19 years
Central American Indians
0.0
/100
|
#295
Tragic
20.4%
Armenians
0.0
/100
|
#296
Tragic
20.5%
Alsatians
0.0
/100
|
#297
Tragic
20.5%
Haitians
0.0
/100
|
#298
Tragic
20.5%
Immigrants | Uzbekistan
0.0
/100
|
#299
Tragic
20.5%
Ecuadorians
0.0
/100
|
#300
Tragic
20.5%
Immigrants | Ecuador
0.0
/100
|
#301
Tragic
20.9%
Immigrants | Caribbean
0.0
/100
|
#302
Tragic
20.9%
Senegalese
0.0
/100
|
#303
Tragic
21.0%
Aleuts
0.0
/100
|
#304
Tragic
21.2%
Immigrants | Senegal
0.0
/100
|
#305
Tragic
21.2%
U.S. Virgin Islanders
0.0
/100
|
#306
Tragic
21.3%
Blacks/African Americans
0.0
/100
|
#307
Tragic
21.4%
Immigrants | Bangladesh
0.0
/100
|
#308
Tragic
21.5%
Natives/Alaskans
0.0
/100
|
#309
Tragic
21.5%

Demographics Similar to Immigrants from Europe by Unemployment Among Ages 16 to 19 years

In terms of unemployment among ages 16 to 19 years, the demographic groups most similar to Immigrants from Europe are Marshallese (17.6%, a difference of 0.010%), Immigrants from Nicaragua (17.6%, a difference of 0.020%), Immigrants from Micronesia (17.6%, a difference of 0.030%), Immigrants from Costa Rica (17.6%, a difference of 0.030%), and Japanese (17.6%, a difference of 0.060%).
DemographicsRating | RankUnemployment Among Ages 16 to 19 years
Russians
45.2
/100
|
#182
Average
17.6%
Immigrants | Uruguay
44.6
/100
|
#183
Average
17.6%
Eastern Europeans
44.3
/100
|
#184
Average
17.6%
Iroquois
43.4
/100
|
#185
Average
17.6%
Japanese
43.2
/100
|
#186
Average
17.6%
Immigrants | Micronesia
42.4
/100
|
#187
Average
17.6%
Immigrants | Nicaragua
42.2
/100
|
#188
Average
17.6%
Immigrants | Europe
41.8
/100
|
#189
Average
17.6%
Marshallese
41.7
/100
|
#190
Average
17.6%
Immigrants | Costa Rica
41.3
/100
|
#191
Average
17.6%
Immigrants | Philippines
40.7
/100
|
#192
Average
17.7%
Immigrants | Australia
40.6
/100
|
#193
Average
17.7%
Peruvians
38.8
/100
|
#194
Fair
17.7%
Immigrants | Peru
37.3
/100
|
#195
Fair
17.7%
Alaskan Athabascans
34.1
/100
|
#196
Fair
17.7%