Immigrants from Caribbean vs Apache Unemployment Among Ages 60 to 64 years
COMPARE
Immigrants from Caribbean
Apache
Unemployment Among Ages 60 to 64 years
Unemployment Among Ages 60 to 64 years Comparison
Immigrants from Caribbean
Apache
5.2%
UNEMPLOYMENT AMONG AGES 60 TO 64 YEARS
0.0/ 100
METRIC RATING
277th/ 347
METRIC RANK
6.0%
UNEMPLOYMENT AMONG AGES 60 TO 64 YEARS
0.0/ 100
METRIC RATING
328th/ 347
METRIC RANK
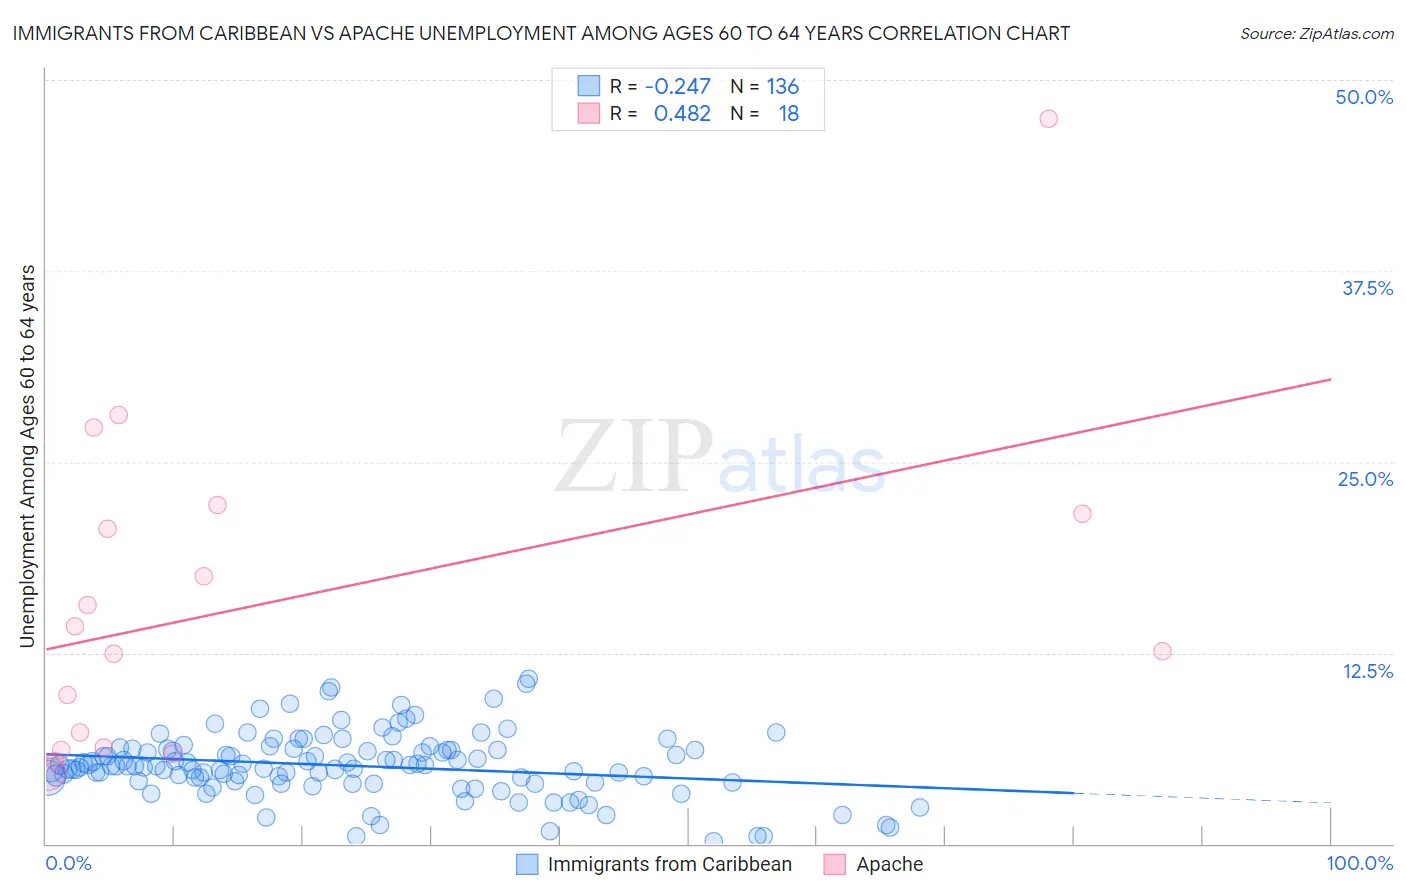
Immigrants from Caribbean vs Apache Unemployment Among Ages 60 to 64 years Correlation Chart
The statistical analysis conducted on geographies consisting of 400,660,483 people shows a weak negative correlation between the proportion of Immigrants from Caribbean and unemployment rate among population between the ages 60 and 64 in the United States with a correlation coefficient (R) of -0.247 and weighted average of 5.2%. Similarly, the statistical analysis conducted on geographies consisting of 214,919,581 people shows a moderate positive correlation between the proportion of Apache and unemployment rate among population between the ages 60 and 64 in the United States with a correlation coefficient (R) of 0.482 and weighted average of 6.0%, a difference of 14.3%.
Unemployment Among Ages 60 to 64 years Correlation Summary
| Measurement | Immigrants from Caribbean | Apache |
| Minimum | 0.20% | 4.6% |
| Maximum | 10.8% | 47.5% |
| Range | 10.6% | 42.9% |
| Mean | 5.1% | 15.8% |
| Median | 5.1% | 13.4% |
| Interquartile 25% (IQ1) | 4.0% | 6.3% |
| Interquartile 75% (IQ3) | 6.1% | 21.6% |
| Interquartile Range (IQR) | 2.1% | 15.3% |
| Standard Deviation (Sample) | 2.1% | 10.9% |
| Standard Deviation (Population) | 2.1% | 10.6% |
Similar Demographics by Unemployment Among Ages 60 to 64 years
Demographics Similar to Immigrants from Caribbean by Unemployment Among Ages 60 to 64 years
In terms of unemployment among ages 60 to 64 years, the demographic groups most similar to Immigrants from Caribbean are Central American (5.2%, a difference of 0.27%), Guatemalan (5.2%, a difference of 0.37%), Immigrants from Hong Kong (5.2%, a difference of 0.43%), Hopi (5.2%, a difference of 0.57%), and Nepalese (5.2%, a difference of 0.57%).
| Demographics | Rating | Rank | Unemployment Among Ages 60 to 64 years |
| Immigrants | Iran | 0.1 /100 | #270 | Tragic 5.1% |
| Israelis | 0.1 /100 | #271 | Tragic 5.2% |
| Haitians | 0.1 /100 | #272 | Tragic 5.2% |
| Immigrants | Spain | 0.1 /100 | #273 | Tragic 5.2% |
| Hopi | 0.1 /100 | #274 | Tragic 5.2% |
| Immigrants | Hong Kong | 0.1 /100 | #275 | Tragic 5.2% |
| Central Americans | 0.0 /100 | #276 | Tragic 5.2% |
| Immigrants | Caribbean | 0.0 /100 | #277 | Tragic 5.2% |
| Guatemalans | 0.0 /100 | #278 | Tragic 5.2% |
| Nepalese | 0.0 /100 | #279 | Tragic 5.2% |
| French American Indians | 0.0 /100 | #280 | Tragic 5.2% |
| Immigrants | Haiti | 0.0 /100 | #281 | Tragic 5.2% |
| Mexicans | 0.0 /100 | #282 | Tragic 5.2% |
| Immigrants | Guatemala | 0.0 /100 | #283 | Tragic 5.3% |
| Taiwanese | 0.0 /100 | #284 | Tragic 5.3% |
Demographics Similar to Apache by Unemployment Among Ages 60 to 64 years
In terms of unemployment among ages 60 to 64 years, the demographic groups most similar to Apache are Immigrants from Bangladesh (6.0%, a difference of 0.010%), Immigrants from Armenia (6.0%, a difference of 0.27%), Yakama (6.0%, a difference of 0.40%), Dominican (6.0%, a difference of 0.43%), and Immigrants from Dominican Republic (6.0%, a difference of 0.78%).
| Demographics | Rating | Rank | Unemployment Among Ages 60 to 64 years |
| Dutch West Indians | 0.0 /100 | #321 | Tragic 5.7% |
| Ecuadorians | 0.0 /100 | #322 | Tragic 5.8% |
| Alsatians | 0.0 /100 | #323 | Tragic 5.8% |
| Immigrants | Ecuador | 0.0 /100 | #324 | Tragic 5.8% |
| Paiute | 0.0 /100 | #325 | Tragic 5.8% |
| Immigrants | St. Vincent and the Grenadines | 0.0 /100 | #326 | Tragic 5.9% |
| Immigrants | Grenada | 0.0 /100 | #327 | Tragic 5.9% |
| Apache | 0.0 /100 | #328 | Tragic 6.0% |
| Immigrants | Bangladesh | 0.0 /100 | #329 | Tragic 6.0% |
| Immigrants | Armenia | 0.0 /100 | #330 | Tragic 6.0% |
| Yakama | 0.0 /100 | #331 | Tragic 6.0% |
| Dominicans | 0.0 /100 | #332 | Tragic 6.0% |
| Immigrants | Dominican Republic | 0.0 /100 | #333 | Tragic 6.0% |
| Puerto Ricans | 0.0 /100 | #334 | Tragic 6.1% |
| Vietnamese | 0.0 /100 | #335 | Tragic 6.1% |