Immigrants from Canada vs Bolivian Unemployment Among Ages 55 to 59 years

COMPARE

Immigrants from Canada
Race
Ancestry
AfghanAfricanAlaska NativeAlaskan AthabascanAlbanianAleutAlsatianAmericanApacheArabArapahoArgentineanArmenianAssyrian/Chaldean/SyriacAustralianAustrianBahamianBangladeshiBarbadianBasqueBelgianBelizeanBermudanBhutaneseBlackfeetBrazilianBritishBritish West IndianBulgarianBurmeseCajunCambodianCanadianCape VerdeanCarpatho RusynCelticCentral AmericanCentral American IndianCherokeeCheyenneChickasawChileanChineseChippewaChoctawColombianColvilleComancheCosta RicanCreeCreekCroatianCrowCubanCypriotCzechCzechoslovakianDanishDelawareDominicanDutchDutch West IndianEastern EuropeanEcuadorianEgyptianEnglishEstonianEthiopianEuropeanFijianFilipinoFinnishFrenchFrench American IndianFrench CanadianGermanGerman RussianGhanaianGreekGuamanian/ChamorroGuatemalanGuyaneseHaitianHmongHonduranHopiHoumaHungarianIcelanderIndian (Asian)IndonesianInupiatIranianIraqiIrishIroquoisIsraeliItalianJamaicanJapaneseJordanianKenyanKiowaKoreanLaotianLatvianLebaneseLiberianLithuanianLumbeeLuxembourgerMacedonianMalaysianMalteseMarshalleseMenomineeMexicanMexican American IndianMongolianMoroccanNative HawaiianNavajoNepaleseNew ZealanderNicaraguanNigerianNorthern EuropeanNorwegianOkinawanOsageOttawaPaiutePakistaniPalestinianPanamanianParaguayanPennsylvania GermanPeruvianPimaPolishPortuguesePotawatomiPuebloPuerto RicanPuget Sound SalishRomanianRussianSalvadoranSamoanScandinavianScotch-IrishScottishSeminoleSenegaleseSerbianShoshoneSierra LeoneanSiouxSlavicSlovakSloveneSomaliSouth AfricanSouth AmericanSouth American IndianSoviet UnionSpaniardSpanishSpanish AmericanSpanish American IndianSri LankanSubsaharan AfricanSudaneseSwedishSwissSyrianTaiwaneseThaiTlingit-HaidaTohono O'OdhamTonganTrinidadian and TobagonianTsimshianTurkishU.S. Virgin IslanderUgandanUkrainianUruguayanUteVenezuelanVietnameseWelshWest IndianYakamaYaquiYugoslavianYumanYup'ikZimbabwean
Immigration
NonimmigrantsImmigrantsAfghanistanAfricaAlbaniaArgentinaArmeniaAsiaAustraliaAustriaBahamasBangladeshBarbadosBelarusBelgiumBelizeBoliviaBosnia and HerzegovinaBrazilBulgariaBurma/MyanmarCabo VerdeCambodiaCameroonCanadaCaribbeanCentral AmericaChileChinaColombiaCongoCosta RicaCroatiaCubaCzechoslovakiaDenmarkDominicaDominican RepublicEastern AfricaEastern AsiaEastern EuropeEcuadorEgyptEl SalvadorEnglandEritreaEthiopiaEuropeFijiFranceGermanyGhanaGreeceGrenadaGuatemalaGuyanaHaitiHondurasHong KongHungaryIndiaIndonesiaIranIraqIrelandIsraelItalyJamaicaJapanJordanKazakhstanKenyaKoreaKuwaitLaosLatin AmericaLatviaLebanonLiberiaLithuaniaMalaysiaMexicoMicronesiaMiddle AfricaMoldovaMoroccoNepalNetherlandsNicaraguaNigeriaNorth AmericaNorth MacedoniaNorthern AfricaNorthern EuropeNorwayOceaniaPakistanPanamaPeruPhilippinesPolandPortugalRomaniaRussiaSaudi ArabiaScotlandSenegalSerbiaSierra LeoneSingaporeSomaliaSouth AfricaSouth AmericaSouth Central AsiaSouth Eastern AsiaSouthern EuropeSpainSri LankaSt. Vincent and the GrenadinesSudanSwedenSwitzerlandSyriaTaiwanThailandTrinidad and TobagoTurkeyUgandaUkraineUruguayUzbekistanVenezuelaVietnamWest IndiesWestern AfricaWestern AsiaWestern EuropeYemenZaireZimbabweAzores
Bolivian
Race
Ancestry
AfghanAfricanAlaska NativeAlaskan AthabascanAlbanianAleutAlsatianAmericanApacheArabArapahoArgentineanArmenianAssyrian/Chaldean/SyriacAustralianAustrianBahamianBangladeshiBarbadianBasqueBelgianBelizeanBermudanBhutaneseBlackfeetBolivianBrazilianBritishBritish West IndianBulgarianBurmeseCajunCambodianCanadianCape VerdeanCarpatho RusynCelticCentral AmericanCentral American IndianCherokeeCheyenneChickasawChileanChineseChippewaChoctawColombianColvilleComancheCosta RicanCreeCreekCroatianCrowCubanCypriotCzechCzechoslovakianDanishDelawareDominicanDutchDutch West IndianEastern EuropeanEcuadorianEgyptianEnglishEstonianEthiopianEuropeanFijianFilipinoFinnishFrenchFrench American IndianFrench CanadianGermanGerman RussianGhanaianGreekGuamanian/ChamorroGuatemalanGuyaneseHaitianHmongHonduranHopiHoumaHungarianIcelanderIndian (Asian)IndonesianInupiatIranianIraqiIrishIroquoisIsraeliItalianJamaicanJapaneseJordanianKenyanKiowaKoreanLaotianLatvianLebaneseLiberianLithuanianLumbeeLuxembourgerMacedonianMalaysianMalteseMarshalleseMenomineeMexicanMexican American IndianMongolianMoroccanNative HawaiianNavajoNepaleseNew ZealanderNicaraguanNigerianNorthern EuropeanNorwegianOkinawanOsageOttawaPaiutePakistaniPalestinianPanamanianParaguayanPennsylvania GermanPeruvianPimaPolishPortuguesePotawatomiPuebloPuerto RicanPuget Sound SalishRomanianRussianSalvadoranSamoanScandinavianScotch-IrishScottishSeminoleSenegaleseSerbianShoshoneSierra LeoneanSiouxSlavicSlovakSloveneSomaliSouth AfricanSouth AmericanSouth American IndianSoviet UnionSpaniardSpanishSpanish AmericanSpanish American IndianSri LankanSubsaharan AfricanSudaneseSwedishSwissSyrianTaiwaneseThaiTlingit-HaidaTohono O'OdhamTonganTrinidadian and TobagonianTsimshianTurkishU.S. Virgin IslanderUgandanUkrainianUruguayanUteVenezuelanVietnameseWelshWest IndianYakamaYaquiYugoslavianYumanYup'ikZimbabwean
Immigration
NonimmigrantsImmigrantsAfghanistanAfricaAlbaniaArgentinaArmeniaAsiaAustraliaAustriaBahamasBangladeshBarbadosBelarusBelgiumBelizeBoliviaBosnia and HerzegovinaBrazilBulgariaBurma/MyanmarCabo VerdeCambodiaCameroonCaribbeanCentral AmericaChileChinaColombiaCongoCosta RicaCroatiaCubaCzechoslovakiaDenmarkDominicaDominican RepublicEastern AfricaEastern AsiaEastern EuropeEcuadorEgyptEl SalvadorEnglandEritreaEthiopiaEuropeFijiFranceGermanyGhanaGreeceGrenadaGuatemalaGuyanaHaitiHondurasHong KongHungaryIndiaIndonesiaIranIraqIrelandIsraelItalyJamaicaJapanJordanKazakhstanKenyaKoreaKuwaitLaosLatin AmericaLatviaLebanonLiberiaLithuaniaMalaysiaMexicoMicronesiaMiddle AfricaMoldovaMoroccoNepalNetherlandsNicaraguaNigeriaNorth AmericaNorth MacedoniaNorthern AfricaNorthern EuropeNorwayOceaniaPakistanPanamaPeruPhilippinesPolandPortugalRomaniaRussiaSaudi ArabiaScotlandSenegalSerbiaSierra LeoneSingaporeSomaliaSouth AfricaSouth AmericaSouth Central AsiaSouth Eastern AsiaSouthern EuropeSpainSri LankaSt. Vincent and the GrenadinesSudanSwedenSwitzerlandSyriaTaiwanThailandTrinidad and TobagoTurkeyUgandaUkraineUruguayUzbekistanVenezuelaVietnamWest IndiesWestern AfricaWestern AsiaWestern EuropeYemenZaireZimbabweAzores
Unemployment Among Ages 55 to 59 years
Income
Poverty
Unemployment
Labor Participation
Family Structure
Vehicle Availability
Education Level
Disability

Unemployment Among Ages 55 to 59 years Comparison

Immigrants from Canada

Bolivians

Exceptional
Exceptional
4.7%
UNEMPLOYMENT AMONG AGES 55 TO 59 YEARS
94.9/ 100
METRIC RATING
97th/ 347
METRIC RANK
4.2%
UNEMPLOYMENT AMONG AGES 55 TO 59 YEARS
100.0/ 100
METRIC RATING
8th/ 347
METRIC RANK

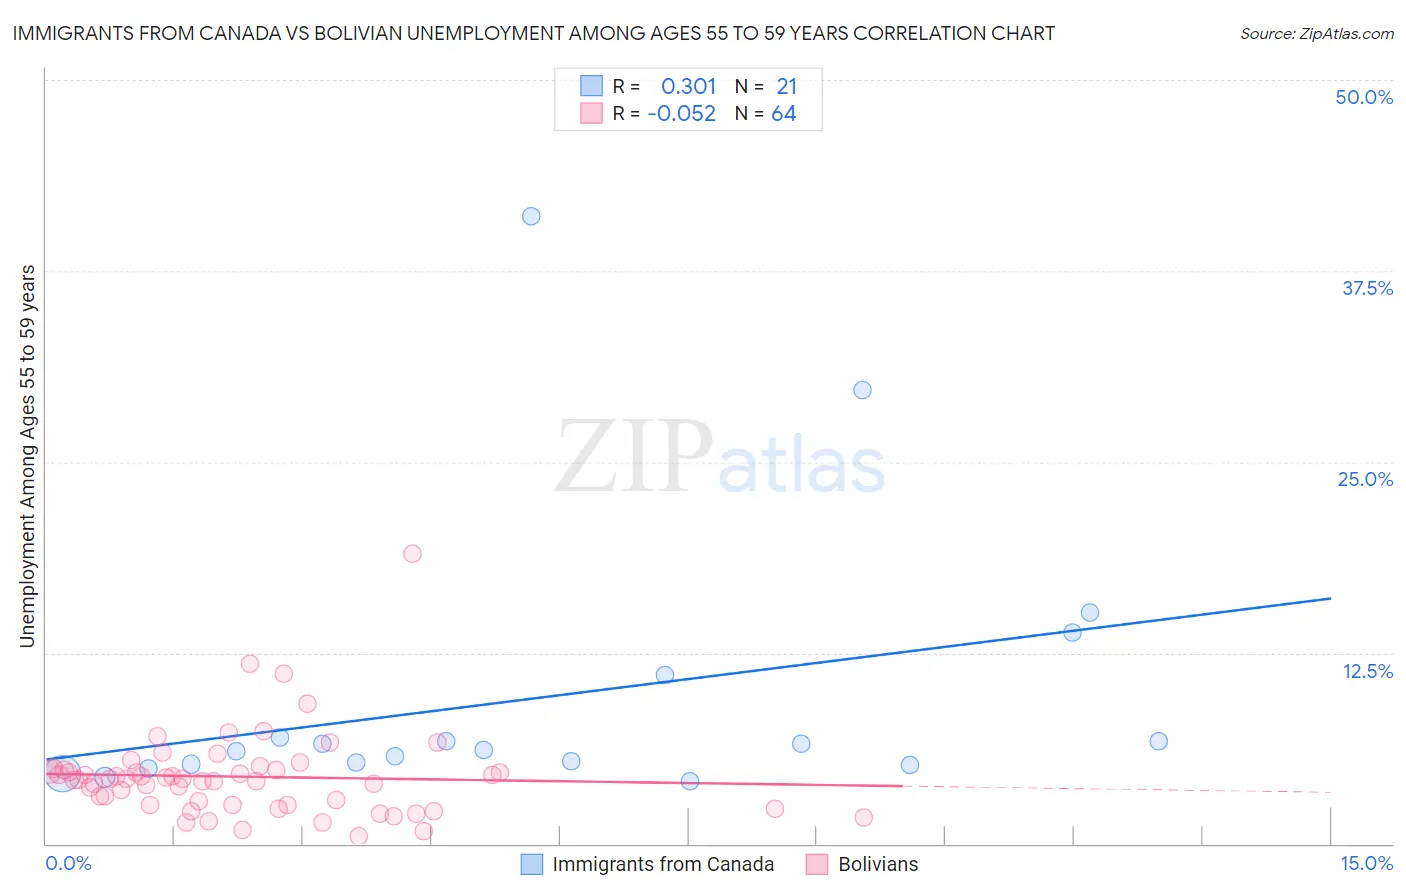
Immigrants from Canada vs Bolivian Unemployment Among Ages 55 to 59 years Correlation Chart

The statistical analysis conducted on geographies consisting of 417,489,457 people shows a mild positive correlation between the proportion of Immigrants from Canada and unemployment rate among population between the ages 55 and 59 in the United States with a correlation coefficient (R) of 0.301 and weighted average of 4.7%. Similarly, the statistical analysis conducted on geographies consisting of 179,064,456 people shows a slight negative correlation between the proportion of Bolivians and unemployment rate among population between the ages 55 and 59 in the United States with a correlation coefficient (R) of -0.052 and weighted average of 4.2%, a difference of 10.4%.
Immigrants from Canada vs Bolivian Unemployment Among Ages 55 to 59 years

Unemployment Among Ages 55 to 59 years Correlation Summary

MeasurementImmigrants from CanadaBolivian
Minimum4.1%0.50%
Maximum41.1%19.0%
Range37.0%18.5%
Mean9.6%4.4%
Median6.1%4.2%
Interquartile 25% (IQ1)5.2%2.5%
Interquartile 75% (IQ3)9.0%4.8%
Interquartile Range (IQR)3.8%2.3%
Standard Deviation (Sample)9.2%2.8%
Standard Deviation (Population)9.0%2.8%

Similar Demographics by Unemployment Among Ages 55 to 59 years

Demographics Similar to Immigrants from Canada by Unemployment Among Ages 55 to 59 years

In terms of unemployment among ages 55 to 59 years, the demographic groups most similar to Immigrants from Canada are Immigrants from Belgium (4.7%, a difference of 0.010%), Immigrants from Germany (4.7%, a difference of 0.010%), Yugoslavian (4.7%, a difference of 0.040%), Serbian (4.7%, a difference of 0.11%), and Celtic (4.7%, a difference of 0.12%).
DemographicsRating | RankUnemployment Among Ages 55 to 59 years
Immigrants | Poland
96.4
/100
|
#90
Exceptional
4.7%
New Zealanders
96.3
/100
|
#91
Exceptional
4.7%
Iraqis
96.1
/100
|
#92
Exceptional
4.7%
Immigrants | England
95.8
/100
|
#93
Exceptional
4.7%
Immigrants | Scotland
95.7
/100
|
#94
Exceptional
4.7%
South Africans
95.6
/100
|
#95
Exceptional
4.7%
Immigrants | Belgium
95.0
/100
|
#96
Exceptional
4.7%
Immigrants | Canada
94.9
/100
|
#97
Exceptional
4.7%
Immigrants | Germany
94.8
/100
|
#98
Exceptional
4.7%
Yugoslavians
94.7
/100
|
#99
Exceptional
4.7%
Serbians
94.4
/100
|
#100
Exceptional
4.7%
Celtics
94.3
/100
|
#101
Exceptional
4.7%
Canadians
94.1
/100
|
#102
Exceptional
4.7%
Immigrants | Oceania
94.0
/100
|
#103
Exceptional
4.7%
Immigrants | Turkey
93.9
/100
|
#104
Exceptional
4.7%

Demographics Similar to Bolivians by Unemployment Among Ages 55 to 59 years

In terms of unemployment among ages 55 to 59 years, the demographic groups most similar to Bolivians are Zimbabwean (4.2%, a difference of 0.12%), Cuban (4.2%, a difference of 0.12%), Norwegian (4.2%, a difference of 0.68%), Tongan (4.3%, a difference of 1.1%), and Immigrants from Bolivia (4.2%, a difference of 1.3%).
DemographicsRating | RankUnemployment Among Ages 55 to 59 years
Fijians
100.0
/100
|
#1
Exceptional
4.1%
Immigrants | Cuba
100.0
/100
|
#2
Exceptional
4.1%
Immigrants | Venezuela
100.0
/100
|
#3
Exceptional
4.1%
Venezuelans
100.0
/100
|
#4
Exceptional
4.2%
Immigrants | Bolivia
100.0
/100
|
#5
Exceptional
4.2%
Norwegians
100.0
/100
|
#6
Exceptional
4.2%
Zimbabweans
100.0
/100
|
#7
Exceptional
4.2%
Bolivians
100.0
/100
|
#8
Exceptional
4.2%
Cubans
100.0
/100
|
#9
Exceptional
4.2%
Tongans
100.0
/100
|
#10
Exceptional
4.3%
Immigrants | Congo
100.0
/100
|
#11
Exceptional
4.3%
Danes
100.0
/100
|
#12
Exceptional
4.3%
Indonesians
100.0
/100
|
#13
Exceptional
4.3%
Immigrants | India
100.0
/100
|
#14
Exceptional
4.3%
Bulgarians
100.0
/100
|
#15
Exceptional
4.3%