Immigrants from Cameroon vs Thai Unemployment Among Youth under 25 years

COMPARE

Immigrants from Cameroon
Race
Ancestry
AfghanAfricanAlaska NativeAlaskan AthabascanAlbanianAleutAlsatianAmericanApacheArabArapahoArgentineanArmenianAssyrian/Chaldean/SyriacAustralianAustrianBahamianBangladeshiBarbadianBasqueBelgianBelizeanBermudanBhutaneseBlackfeetBolivianBrazilianBritishBritish West IndianBulgarianBurmeseCajunCambodianCanadianCape VerdeanCarpatho RusynCelticCentral AmericanCentral American IndianCherokeeCheyenneChickasawChileanChineseChippewaChoctawColombianColvilleComancheCosta RicanCreeCreekCroatianCrowCubanCypriotCzechCzechoslovakianDanishDelawareDominicanDutchDutch West IndianEastern EuropeanEcuadorianEgyptianEnglishEstonianEthiopianEuropeanFijianFilipinoFinnishFrenchFrench American IndianFrench CanadianGermanGerman RussianGhanaianGreekGuamanian/ChamorroGuatemalanGuyaneseHaitianHmongHonduranHopiHoumaHungarianIcelanderIndian (Asian)IndonesianInupiatIranianIraqiIrishIroquoisIsraeliItalianJamaicanJapaneseJordanianKenyanKiowaKoreanLaotianLatvianLebaneseLiberianLithuanianLumbeeLuxembourgerMacedonianMalaysianMalteseMarshalleseMenomineeMexicanMexican American IndianMongolianMoroccanNative HawaiianNavajoNepaleseNew ZealanderNicaraguanNigerianNorthern EuropeanNorwegianOkinawanOsageOttawaPaiutePakistaniPalestinianPanamanianParaguayanPennsylvania GermanPeruvianPimaPolishPortuguesePotawatomiPuebloPuerto RicanPuget Sound SalishRomanianRussianSalvadoranSamoanScandinavianScotch-IrishScottishSeminoleSenegaleseSerbianShoshoneSierra LeoneanSiouxSlavicSlovakSloveneSomaliSouth AfricanSouth AmericanSouth American IndianSoviet UnionSpaniardSpanishSpanish AmericanSpanish American IndianSri LankanSubsaharan AfricanSudaneseSwedishSwissSyrianTaiwaneseTlingit-HaidaTohono O'OdhamTonganTrinidadian and TobagonianTsimshianTurkishU.S. Virgin IslanderUgandanUkrainianUruguayanUteVenezuelanVietnameseWelshWest IndianYakamaYaquiYugoslavianYumanYup'ikZimbabwean
Immigration
NonimmigrantsImmigrantsAfghanistanAfricaAlbaniaArgentinaArmeniaAsiaAustraliaAustriaBahamasBangladeshBarbadosBelarusBelgiumBelizeBoliviaBosnia and HerzegovinaBrazilBulgariaBurma/MyanmarCabo VerdeCambodiaCameroonCanadaCaribbeanCentral AmericaChileChinaColombiaCongoCosta RicaCroatiaCubaCzechoslovakiaDenmarkDominicaDominican RepublicEastern AfricaEastern AsiaEastern EuropeEcuadorEgyptEl SalvadorEnglandEritreaEthiopiaEuropeFijiFranceGermanyGhanaGreeceGrenadaGuatemalaGuyanaHaitiHondurasHong KongHungaryIndiaIndonesiaIranIraqIrelandIsraelItalyJamaicaJapanJordanKazakhstanKenyaKoreaKuwaitLaosLatin AmericaLatviaLebanonLiberiaLithuaniaMalaysiaMexicoMicronesiaMiddle AfricaMoldovaMoroccoNepalNetherlandsNicaraguaNigeriaNorth AmericaNorth MacedoniaNorthern AfricaNorthern EuropeNorwayOceaniaPakistanPanamaPeruPhilippinesPolandPortugalRomaniaRussiaSaudi ArabiaScotlandSenegalSerbiaSierra LeoneSingaporeSomaliaSouth AfricaSouth AmericaSouth Central AsiaSouth Eastern AsiaSouthern EuropeSpainSri LankaSt. Vincent and the GrenadinesSudanSwedenSwitzerlandSyriaTaiwanThailandTrinidad and TobagoTurkeyUgandaUkraineUruguayUzbekistanVenezuelaVietnamWest IndiesWestern AfricaWestern AsiaWestern EuropeYemenZaireZimbabweAzores
Thai
Race
Ancestry
AfghanAfricanAlaska NativeAlaskan AthabascanAlbanianAleutAlsatianAmericanApacheArabArapahoArgentineanArmenianAssyrian/Chaldean/SyriacAustralianAustrianBahamianBangladeshiBarbadianBasqueBelgianBelizeanBermudanBhutaneseBlackfeetBolivianBrazilianBritishBritish West IndianBulgarianBurmeseCajunCambodianCanadianCape VerdeanCarpatho RusynCelticCentral AmericanCentral American IndianCherokeeCheyenneChickasawChileanChineseChippewaChoctawColombianColvilleComancheCosta RicanCreeCreekCroatianCrowCubanCypriotCzechCzechoslovakianDanishDelawareDominicanDutchDutch West IndianEastern EuropeanEcuadorianEgyptianEnglishEstonianEthiopianEuropeanFijianFilipinoFinnishFrenchFrench American IndianFrench CanadianGermanGerman RussianGhanaianGreekGuamanian/ChamorroGuatemalanGuyaneseHaitianHmongHonduranHopiHoumaHungarianIcelanderIndian (Asian)IndonesianInupiatIranianIraqiIrishIroquoisIsraeliItalianJamaicanJapaneseJordanianKenyanKiowaKoreanLaotianLatvianLebaneseLiberianLithuanianLumbeeLuxembourgerMacedonianMalaysianMalteseMarshalleseMenomineeMexicanMexican American IndianMongolianMoroccanNative HawaiianNavajoNepaleseNew ZealanderNicaraguanNigerianNorthern EuropeanNorwegianOkinawanOsageOttawaPaiutePakistaniPalestinianPanamanianParaguayanPennsylvania GermanPeruvianPimaPolishPortuguesePotawatomiPuebloPuerto RicanPuget Sound SalishRomanianRussianSalvadoranSamoanScandinavianScotch-IrishScottishSeminoleSenegaleseSerbianShoshoneSierra LeoneanSiouxSlavicSlovakSloveneSomaliSouth AfricanSouth AmericanSouth American IndianSoviet UnionSpaniardSpanishSpanish AmericanSpanish American IndianSri LankanSubsaharan AfricanSudaneseSwedishSwissSyrianTaiwaneseThaiTlingit-HaidaTohono O'OdhamTonganTrinidadian and TobagonianTsimshianTurkishU.S. Virgin IslanderUgandanUkrainianUruguayanUteVenezuelanVietnameseWelshWest IndianYakamaYaquiYugoslavianYumanYup'ikZimbabwean
Immigration
NonimmigrantsImmigrantsAfghanistanAfricaAlbaniaArgentinaArmeniaAsiaAustraliaAustriaBahamasBangladeshBarbadosBelarusBelgiumBelizeBoliviaBosnia and HerzegovinaBrazilBulgariaBurma/MyanmarCabo VerdeCambodiaCanadaCaribbeanCentral AmericaChileChinaColombiaCongoCosta RicaCroatiaCubaCzechoslovakiaDenmarkDominicaDominican RepublicEastern AfricaEastern AsiaEastern EuropeEcuadorEgyptEl SalvadorEnglandEritreaEthiopiaEuropeFijiFranceGermanyGhanaGreeceGrenadaGuatemalaGuyanaHaitiHondurasHong KongHungaryIndiaIndonesiaIranIraqIrelandIsraelItalyJamaicaJapanJordanKazakhstanKenyaKoreaKuwaitLaosLatin AmericaLatviaLebanonLiberiaLithuaniaMalaysiaMexicoMicronesiaMiddle AfricaMoldovaMoroccoNepalNetherlandsNicaraguaNigeriaNorth AmericaNorth MacedoniaNorthern AfricaNorthern EuropeNorwayOceaniaPakistanPanamaPeruPhilippinesPolandPortugalRomaniaRussiaSaudi ArabiaScotlandSenegalSerbiaSierra LeoneSingaporeSomaliaSouth AfricaSouth AmericaSouth Central AsiaSouth Eastern AsiaSouthern EuropeSpainSri LankaSt. Vincent and the GrenadinesSudanSwedenSwitzerlandSyriaTaiwanThailandTrinidad and TobagoTurkeyUgandaUkraineUruguayUzbekistanVenezuelaVietnamWest IndiesWestern AfricaWestern AsiaWestern EuropeYemenZaireZimbabweAzores
Unemployment Among Youth under 25 years
Income
Poverty
Unemployment
Labor Participation
Family Structure
Vehicle Availability
Education Level
Disability

Unemployment Among Youth under 25 years Comparison

Immigrants from Cameroon

Thais

Tragic
Exceptional
13.3%
UNEMPLOYMENT AMONG YOUTH UNDER 25 YEARS
0.0/ 100
METRIC RATING
283rd/ 347
METRIC RANK
11.0%
UNEMPLOYMENT AMONG YOUTH UNDER 25 YEARS
99.3/ 100
METRIC RATING
49th/ 347
METRIC RANK

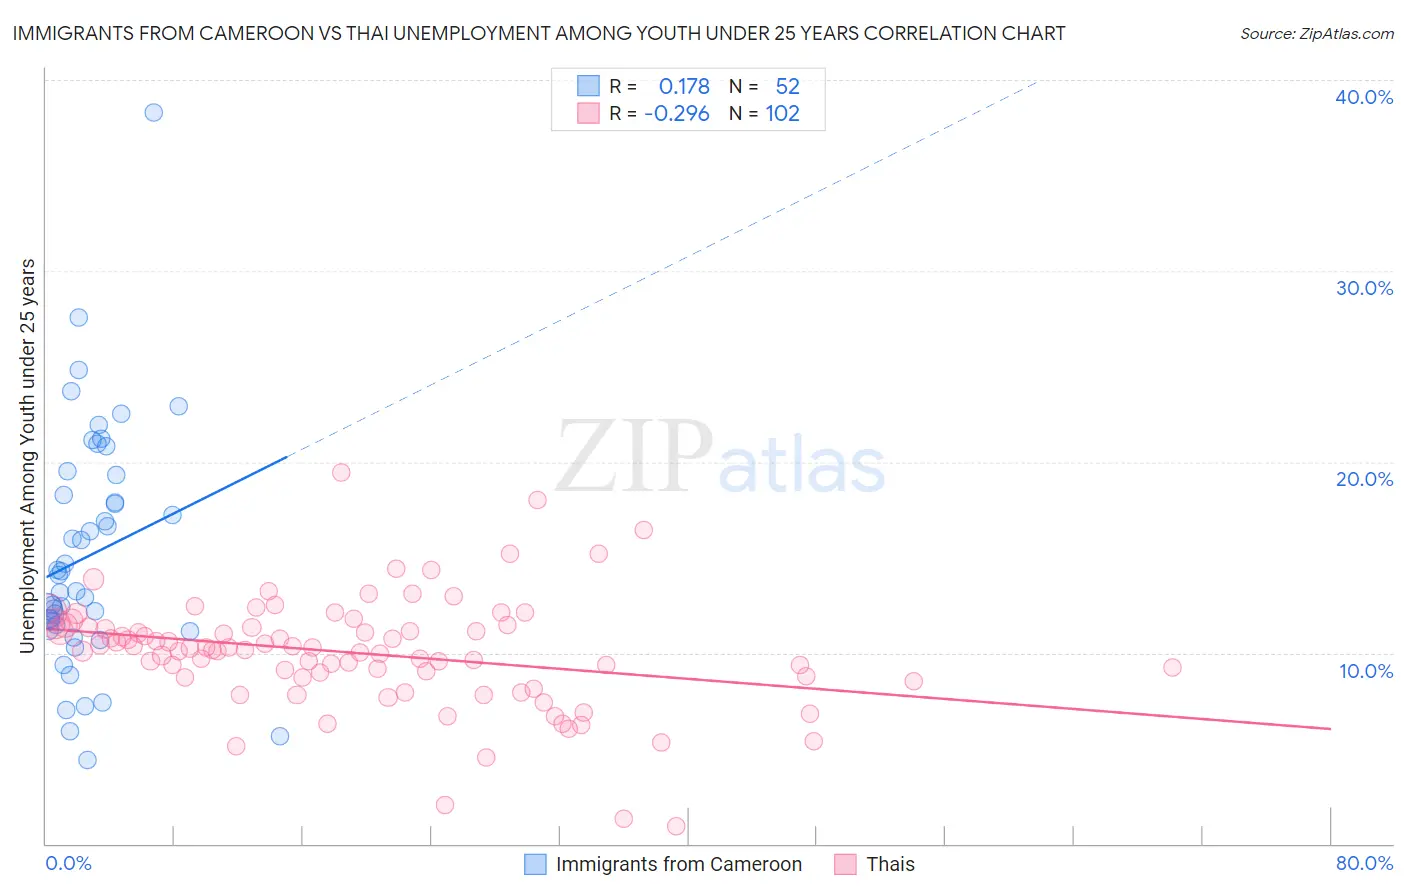
Immigrants from Cameroon vs Thai Unemployment Among Youth under 25 years Correlation Chart

The statistical analysis conducted on geographies consisting of 130,379,690 people shows a poor positive correlation between the proportion of Immigrants from Cameroon and unemployment rate among youth under the age of 25 in the United States with a correlation coefficient (R) of 0.178 and weighted average of 13.3%. Similarly, the statistical analysis conducted on geographies consisting of 468,363,395 people shows a weak negative correlation between the proportion of Thais and unemployment rate among youth under the age of 25 in the United States with a correlation coefficient (R) of -0.296 and weighted average of 11.0%, a difference of 20.6%.
Immigrants from Cameroon vs Thai Unemployment Among Youth under 25 years

Unemployment Among Youth under 25 years Correlation Summary

MeasurementImmigrants from CameroonThai
Minimum4.4%0.90%
Maximum38.3%19.4%
Range33.9%18.5%
Mean15.1%10.0%
Median13.6%10.2%
Interquartile 25% (IQ1)11.3%8.7%
Interquartile 75% (IQ3)18.8%11.3%
Interquartile Range (IQR)7.5%2.6%
Standard Deviation (Sample)6.2%3.0%
Standard Deviation (Population)6.2%2.9%

Similar Demographics by Unemployment Among Youth under 25 years

Demographics Similar to Immigrants from Cameroon by Unemployment Among Youth under 25 years

In terms of unemployment among youth under 25 years, the demographic groups most similar to Immigrants from Cameroon are Lumbee (13.3%, a difference of 0.010%), Sierra Leonean (13.3%, a difference of 0.020%), Armenian (13.3%, a difference of 0.030%), Ute (13.3%, a difference of 0.060%), and Ghanaian (13.3%, a difference of 0.10%).
DemographicsRating | RankUnemployment Among Youth under 25 years
Immigrants | Uzbekistan
0.0
/100
|
#276
Tragic
13.1%
Bahamians
0.0
/100
|
#277
Tragic
13.1%
Africans
0.0
/100
|
#278
Tragic
13.2%
Cajuns
0.0
/100
|
#279
Tragic
13.2%
Ute
0.0
/100
|
#280
Tragic
13.3%
Armenians
0.0
/100
|
#281
Tragic
13.3%
Sierra Leoneans
0.0
/100
|
#282
Tragic
13.3%
Immigrants | Cameroon
0.0
/100
|
#283
Tragic
13.3%
Lumbee
0.0
/100
|
#284
Tragic
13.3%
Ghanaians
0.0
/100
|
#285
Tragic
13.3%
Blackfeet
0.0
/100
|
#286
Tragic
13.3%
Ecuadorians
0.0
/100
|
#287
Tragic
13.3%
Immigrants | Western Africa
0.0
/100
|
#288
Tragic
13.4%
Immigrants | Ghana
0.0
/100
|
#289
Tragic
13.4%
Immigrants | Ecuador
0.0
/100
|
#290
Tragic
13.4%

Demographics Similar to Thais by Unemployment Among Youth under 25 years

In terms of unemployment among youth under 25 years, the demographic groups most similar to Thais are Polish (11.0%, a difference of 0.070%), Czechoslovakian (11.0%, a difference of 0.090%), Serbian (11.0%, a difference of 0.33%), Latvian (11.0%, a difference of 0.34%), and Ottawa (11.1%, a difference of 0.43%).
DemographicsRating | RankUnemployment Among Youth under 25 years
Cambodians
99.7
/100
|
#42
Exceptional
10.9%
British
99.7
/100
|
#43
Exceptional
10.9%
Welsh
99.7
/100
|
#44
Exceptional
10.9%
Bulgarians
99.6
/100
|
#45
Exceptional
10.9%
Tongans
99.6
/100
|
#46
Exceptional
10.9%
Australians
99.6
/100
|
#47
Exceptional
10.9%
Poles
99.3
/100
|
#48
Exceptional
11.0%
Thais
99.3
/100
|
#49
Exceptional
11.0%
Czechoslovakians
99.2
/100
|
#50
Exceptional
11.0%
Serbians
99.0
/100
|
#51
Exceptional
11.0%
Latvians
99.0
/100
|
#52
Exceptional
11.0%
Ottawa
99.0
/100
|
#53
Exceptional
11.1%
Mongolians
98.9
/100
|
#54
Exceptional
11.1%
Irish
98.9
/100
|
#55
Exceptional
11.1%
Immigrants | Saudi Arabia
98.8
/100
|
#56
Exceptional
11.1%