Immigrants from Cameroon vs Portuguese Unemployment
COMPARE
Immigrants from Cameroon
Portuguese
Unemployment
Unemployment Comparison
Immigrants from Cameroon
Portuguese
5.6%
UNEMPLOYMENT
1.0/ 100
METRIC RATING
247th/ 347
METRIC RANK
5.4%
UNEMPLOYMENT
19.0/ 100
METRIC RATING
208th/ 347
METRIC RANK
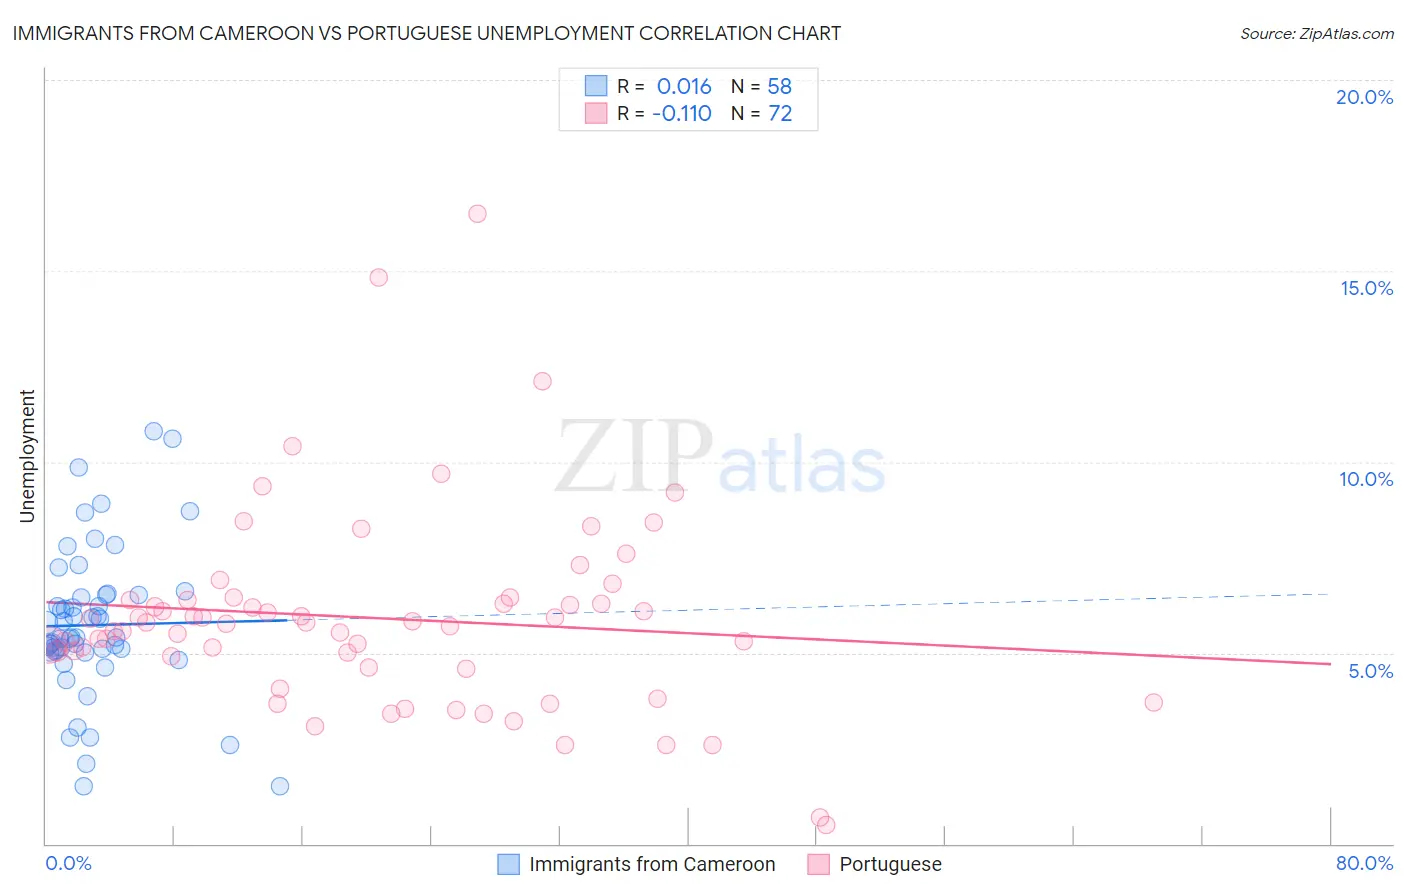
Immigrants from Cameroon vs Portuguese Unemployment Correlation Chart
The statistical analysis conducted on geographies consisting of 130,734,727 people shows no correlation between the proportion of Immigrants from Cameroon and unemployment in the United States with a correlation coefficient (R) of 0.016 and weighted average of 5.6%. Similarly, the statistical analysis conducted on geographies consisting of 449,464,903 people shows a poor negative correlation between the proportion of Portuguese and unemployment in the United States with a correlation coefficient (R) of -0.110 and weighted average of 5.4%, a difference of 4.7%.
Unemployment Correlation Summary
| Measurement | Immigrants from Cameroon | Portuguese |
| Minimum | 1.5% | 0.50% |
| Maximum | 10.8% | 16.5% |
| Range | 9.3% | 16.0% |
| Mean | 5.7% | 5.9% |
| Median | 5.4% | 5.8% |
| Interquartile 25% (IQ1) | 5.1% | 4.8% |
| Interquartile 75% (IQ3) | 6.5% | 6.4% |
| Interquartile Range (IQR) | 1.4% | 1.6% |
| Standard Deviation (Sample) | 1.9% | 2.6% |
| Standard Deviation (Population) | 1.9% | 2.6% |
Similar Demographics by Unemployment
Demographics Similar to Immigrants from Cameroon by Unemployment
In terms of unemployment, the demographic groups most similar to Immigrants from Cameroon are Liberian (5.6%, a difference of 0.13%), Bermudan (5.6%, a difference of 0.15%), French American Indian (5.6%, a difference of 0.19%), Dutch West Indian (5.6%, a difference of 0.21%), and Marshallese (5.6%, a difference of 0.36%).
| Demographics | Rating | Rank | Unemployment |
| Cree | 2.6 /100 | #240 | Tragic 5.6% |
| Tlingit-Haida | 2.0 /100 | #241 | Tragic 5.6% |
| Spanish Americans | 2.0 /100 | #242 | Tragic 5.6% |
| Marshallese | 1.3 /100 | #243 | Tragic 5.6% |
| Dutch West Indians | 1.2 /100 | #244 | Tragic 5.6% |
| French American Indians | 1.2 /100 | #245 | Tragic 5.6% |
| Bermudans | 1.1 /100 | #246 | Tragic 5.6% |
| Immigrants | Cameroon | 1.0 /100 | #247 | Tragic 5.6% |
| Liberians | 0.9 /100 | #248 | Tragic 5.6% |
| Cajuns | 0.8 /100 | #249 | Tragic 5.6% |
| Japanese | 0.8 /100 | #250 | Tragic 5.6% |
| Kiowa | 0.6 /100 | #251 | Tragic 5.7% |
| Hondurans | 0.3 /100 | #252 | Tragic 5.7% |
| Central Americans | 0.3 /100 | #253 | Tragic 5.7% |
| Immigrants | Honduras | 0.3 /100 | #254 | Tragic 5.7% |
Demographics Similar to Portuguese by Unemployment
In terms of unemployment, the demographic groups most similar to Portuguese are Creek (5.4%, a difference of 0.030%), Immigrants from Iran (5.4%, a difference of 0.030%), Immigrants from Iraq (5.4%, a difference of 0.050%), Iraqi (5.4%, a difference of 0.10%), and Ugandan (5.4%, a difference of 0.11%).
| Demographics | Rating | Rank | Unemployment |
| Immigrants | South Eastern Asia | 27.0 /100 | #201 | Fair 5.3% |
| Cherokee | 25.5 /100 | #202 | Fair 5.3% |
| Immigrants | Micronesia | 25.2 /100 | #203 | Fair 5.3% |
| Immigrants | Ukraine | 24.9 /100 | #204 | Fair 5.3% |
| Native Hawaiians | 24.1 /100 | #205 | Fair 5.3% |
| Immigrants | Peru | 22.7 /100 | #206 | Fair 5.4% |
| Creek | 19.4 /100 | #207 | Poor 5.4% |
| Portuguese | 19.0 /100 | #208 | Poor 5.4% |
| Immigrants | Iran | 18.8 /100 | #209 | Poor 5.4% |
| Immigrants | Iraq | 18.6 /100 | #210 | Poor 5.4% |
| Iraqis | 18.1 /100 | #211 | Poor 5.4% |
| Ugandans | 18.0 /100 | #212 | Poor 5.4% |
| Immigrants | Middle Africa | 15.3 /100 | #213 | Poor 5.4% |
| Immigrants | Costa Rica | 15.2 /100 | #214 | Poor 5.4% |
| Delaware | 14.7 /100 | #215 | Poor 5.4% |