Immigrants from Cameroon vs Immigrants from Micronesia Unemployment Among Ages 30 to 34 years

COMPARE

Immigrants from Cameroon
Race
Ancestry
AfghanAfricanAlaska NativeAlaskan AthabascanAlbanianAleutAlsatianAmericanApacheArabArapahoArgentineanArmenianAssyrian/Chaldean/SyriacAustralianAustrianBahamianBangladeshiBarbadianBasqueBelgianBelizeanBermudanBhutaneseBlackfeetBolivianBrazilianBritishBritish West IndianBulgarianBurmeseCajunCambodianCanadianCape VerdeanCarpatho RusynCelticCentral AmericanCentral American IndianCherokeeCheyenneChickasawChileanChineseChippewaChoctawColombianColvilleComancheCosta RicanCreeCreekCroatianCrowCubanCypriotCzechCzechoslovakianDanishDelawareDominicanDutchDutch West IndianEastern EuropeanEcuadorianEgyptianEnglishEstonianEthiopianEuropeanFijianFilipinoFinnishFrenchFrench American IndianFrench CanadianGermanGerman RussianGhanaianGreekGuamanian/ChamorroGuatemalanGuyaneseHaitianHmongHonduranHopiHoumaHungarianIcelanderIndian (Asian)IndonesianInupiatIranianIraqiIrishIroquoisIsraeliItalianJamaicanJapaneseJordanianKenyanKiowaKoreanLaotianLatvianLebaneseLiberianLithuanianLumbeeLuxembourgerMacedonianMalaysianMalteseMarshalleseMenomineeMexicanMexican American IndianMongolianMoroccanNative HawaiianNavajoNepaleseNew ZealanderNicaraguanNigerianNorthern EuropeanNorwegianOkinawanOsageOttawaPaiutePakistaniPalestinianPanamanianParaguayanPennsylvania GermanPeruvianPimaPolishPortuguesePotawatomiPuebloPuerto RicanPuget Sound SalishRomanianRussianSalvadoranSamoanScandinavianScotch-IrishScottishSeminoleSenegaleseSerbianShoshoneSierra LeoneanSiouxSlavicSlovakSloveneSomaliSouth AfricanSouth AmericanSouth American IndianSoviet UnionSpaniardSpanishSpanish AmericanSpanish American IndianSri LankanSubsaharan AfricanSudaneseSwedishSwissSyrianTaiwaneseThaiTlingit-HaidaTohono O'OdhamTonganTrinidadian and TobagonianTsimshianTurkishU.S. Virgin IslanderUgandanUkrainianUruguayanUteVenezuelanVietnameseWelshWest IndianYakamaYaquiYugoslavianYumanYup'ikZimbabwean
Immigration
NonimmigrantsImmigrantsAfghanistanAfricaAlbaniaArgentinaArmeniaAsiaAustraliaAustriaBahamasBangladeshBarbadosBelarusBelgiumBelizeBoliviaBosnia and HerzegovinaBrazilBulgariaBurma/MyanmarCabo VerdeCambodiaCameroonCanadaCaribbeanCentral AmericaChileChinaColombiaCongoCosta RicaCroatiaCubaCzechoslovakiaDenmarkDominicaDominican RepublicEastern AfricaEastern AsiaEastern EuropeEcuadorEgyptEl SalvadorEnglandEritreaEthiopiaEuropeFijiFranceGermanyGhanaGreeceGrenadaGuatemalaGuyanaHaitiHondurasHong KongHungaryIndiaIndonesiaIranIraqIrelandIsraelItalyJamaicaJapanJordanKazakhstanKenyaKoreaKuwaitLaosLatin AmericaLatviaLebanonLiberiaLithuaniaMalaysiaMexicoMiddle AfricaMoldovaMoroccoNepalNetherlandsNicaraguaNigeriaNorth AmericaNorth MacedoniaNorthern AfricaNorthern EuropeNorwayOceaniaPakistanPanamaPeruPhilippinesPolandPortugalRomaniaRussiaSaudi ArabiaScotlandSenegalSerbiaSierra LeoneSingaporeSomaliaSouth AfricaSouth AmericaSouth Central AsiaSouth Eastern AsiaSouthern EuropeSpainSri LankaSt. Vincent and the GrenadinesSudanSwedenSwitzerlandSyriaTaiwanThailandTrinidad and TobagoTurkeyUgandaUkraineUruguayUzbekistanVenezuelaVietnamWest IndiesWestern AfricaWestern AsiaWestern EuropeYemenZaireZimbabweAzores
Immigrants from Micronesia
Race
Ancestry
AfghanAfricanAlaska NativeAlaskan AthabascanAlbanianAleutAlsatianAmericanApacheArabArapahoArgentineanArmenianAssyrian/Chaldean/SyriacAustralianAustrianBahamianBangladeshiBarbadianBasqueBelgianBelizeanBermudanBhutaneseBlackfeetBolivianBrazilianBritishBritish West IndianBulgarianBurmeseCajunCambodianCanadianCape VerdeanCarpatho RusynCelticCentral AmericanCentral American IndianCherokeeCheyenneChickasawChileanChineseChippewaChoctawColombianColvilleComancheCosta RicanCreeCreekCroatianCrowCubanCypriotCzechCzechoslovakianDanishDelawareDominicanDutchDutch West IndianEastern EuropeanEcuadorianEgyptianEnglishEstonianEthiopianEuropeanFijianFilipinoFinnishFrenchFrench American IndianFrench CanadianGermanGerman RussianGhanaianGreekGuamanian/ChamorroGuatemalanGuyaneseHaitianHmongHonduranHopiHoumaHungarianIcelanderIndian (Asian)IndonesianInupiatIranianIraqiIrishIroquoisIsraeliItalianJamaicanJapaneseJordanianKenyanKiowaKoreanLaotianLatvianLebaneseLiberianLithuanianLumbeeLuxembourgerMacedonianMalaysianMalteseMarshalleseMenomineeMexicanMexican American IndianMongolianMoroccanNative HawaiianNavajoNepaleseNew ZealanderNicaraguanNigerianNorthern EuropeanNorwegianOkinawanOsageOttawaPaiutePakistaniPalestinianPanamanianParaguayanPennsylvania GermanPeruvianPimaPolishPortuguesePotawatomiPuebloPuerto RicanPuget Sound SalishRomanianRussianSalvadoranSamoanScandinavianScotch-IrishScottishSeminoleSenegaleseSerbianShoshoneSierra LeoneanSiouxSlavicSlovakSloveneSomaliSouth AfricanSouth AmericanSouth American IndianSoviet UnionSpaniardSpanishSpanish AmericanSpanish American IndianSri LankanSubsaharan AfricanSudaneseSwedishSwissSyrianTaiwaneseThaiTlingit-HaidaTohono O'OdhamTonganTrinidadian and TobagonianTsimshianTurkishU.S. Virgin IslanderUgandanUkrainianUruguayanUteVenezuelanVietnameseWelshWest IndianYakamaYaquiYugoslavianYumanYup'ikZimbabwean
Immigration
NonimmigrantsImmigrantsAfghanistanAfricaAlbaniaArgentinaArmeniaAsiaAustraliaAustriaBahamasBangladeshBarbadosBelarusBelgiumBelizeBoliviaBosnia and HerzegovinaBrazilBulgariaBurma/MyanmarCabo VerdeCambodiaCanadaCaribbeanCentral AmericaChileChinaColombiaCongoCosta RicaCroatiaCubaCzechoslovakiaDenmarkDominicaDominican RepublicEastern AfricaEastern AsiaEastern EuropeEcuadorEgyptEl SalvadorEnglandEritreaEthiopiaEuropeFijiFranceGermanyGhanaGreeceGrenadaGuatemalaGuyanaHaitiHondurasHong KongHungaryIndiaIndonesiaIranIraqIrelandIsraelItalyJamaicaJapanJordanKazakhstanKenyaKoreaKuwaitLaosLatin AmericaLatviaLebanonLiberiaLithuaniaMalaysiaMexicoMicronesiaMiddle AfricaMoldovaMoroccoNepalNetherlandsNicaraguaNigeriaNorth AmericaNorth MacedoniaNorthern AfricaNorthern EuropeNorwayOceaniaPakistanPanamaPeruPhilippinesPolandPortugalRomaniaRussiaSaudi ArabiaScotlandSenegalSerbiaSierra LeoneSingaporeSomaliaSouth AfricaSouth AmericaSouth Central AsiaSouth Eastern AsiaSouthern EuropeSpainSri LankaSt. Vincent and the GrenadinesSudanSwedenSwitzerlandSyriaTaiwanThailandTrinidad and TobagoTurkeyUgandaUkraineUruguayUzbekistanVenezuelaVietnamWest IndiesWestern AfricaWestern AsiaWestern EuropeYemenZaireZimbabweAzores
Unemployment Among Ages 30 to 34 years
Income
Poverty
Unemployment
Labor Participation
Family Structure
Vehicle Availability
Education Level
Disability

Unemployment Among Ages 30 to 34 years Comparison

Immigrants from Cameroon

Immigrants from Micronesia

Poor
Tragic
5.6%
UNEMPLOYMENT AMONG AGES 30 TO 34 YEARS
18.4/ 100
METRIC RATING
204th/ 347
METRIC RANK
6.0%
UNEMPLOYMENT AMONG AGES 30 TO 34 YEARS
0.3/ 100
METRIC RATING
244th/ 347
METRIC RANK

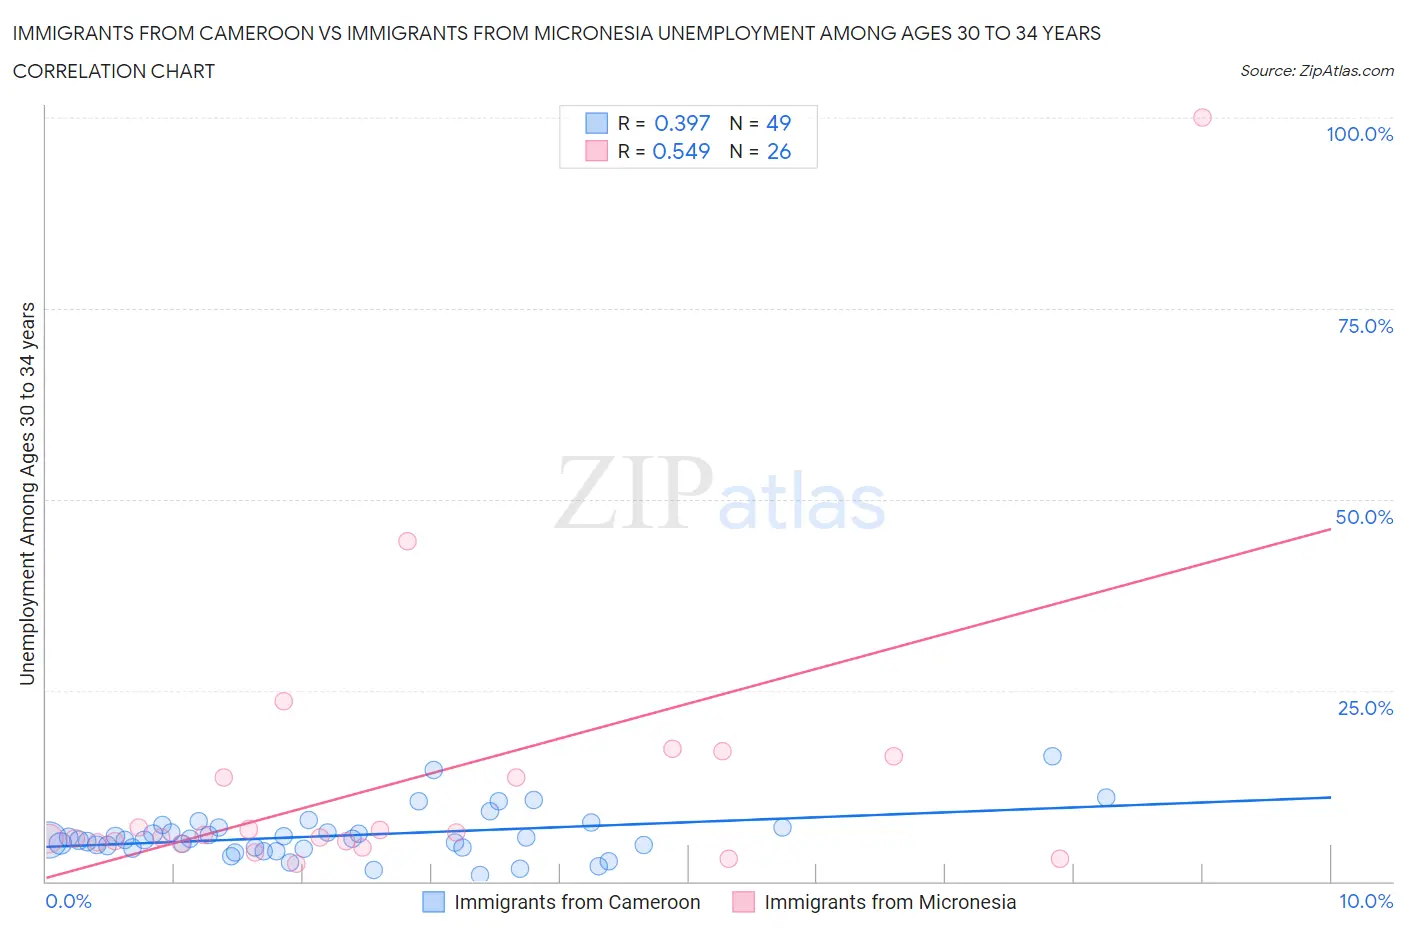
Immigrants from Cameroon vs Immigrants from Micronesia Unemployment Among Ages 30 to 34 years Correlation Chart

The statistical analysis conducted on geographies consisting of 128,849,811 people shows a mild positive correlation between the proportion of Immigrants from Cameroon and unemployment rate among population between the ages 30 and 34 in the United States with a correlation coefficient (R) of 0.397 and weighted average of 5.6%. Similarly, the statistical analysis conducted on geographies consisting of 60,757,387 people shows a substantial positive correlation between the proportion of Immigrants from Micronesia and unemployment rate among population between the ages 30 and 34 in the United States with a correlation coefficient (R) of 0.549 and weighted average of 6.0%, a difference of 7.1%.
Immigrants from Cameroon vs Immigrants from Micronesia Unemployment Among Ages 30 to 34 years

Unemployment Among Ages 30 to 34 years Correlation Summary

MeasurementImmigrants from CameroonImmigrants from Micronesia
Minimum0.90%2.3%
Maximum16.3%100.0%
Range15.4%97.7%
Mean6.0%13.0%
Median5.5%5.9%
Interquartile 25% (IQ1)4.4%5.1%
Interquartile 75% (IQ3)7.0%13.6%
Interquartile Range (IQR)2.6%8.5%
Standard Deviation (Sample)3.0%19.9%
Standard Deviation (Population)3.0%19.5%

Similar Demographics by Unemployment Among Ages 30 to 34 years

Demographics Similar to Immigrants from Cameroon by Unemployment Among Ages 30 to 34 years

In terms of unemployment among ages 30 to 34 years, the demographic groups most similar to Immigrants from Cameroon are Korean (5.6%, a difference of 0.25%), Immigrants from Germany (5.6%, a difference of 0.47%), Immigrants from Costa Rica (5.6%, a difference of 0.49%), Alsatian (5.6%, a difference of 0.50%), and South American Indian (5.6%, a difference of 0.61%).
DemographicsRating | RankUnemployment Among Ages 30 to 34 years
Immigrants | Nicaragua
28.9
/100
|
#197
Fair
5.5%
Immigrants | Afghanistan
27.2
/100
|
#198
Fair
5.6%
Nicaraguans
26.6
/100
|
#199
Fair
5.6%
Immigrants | Southern Europe
25.8
/100
|
#200
Fair
5.6%
South American Indians
24.4
/100
|
#201
Fair
5.6%
Immigrants | Germany
22.9
/100
|
#202
Fair
5.6%
Koreans
20.7
/100
|
#203
Fair
5.6%
Immigrants | Cameroon
18.4
/100
|
#204
Poor
5.6%
Immigrants | Costa Rica
14.4
/100
|
#205
Poor
5.6%
Alsatians
14.3
/100
|
#206
Poor
5.6%
Israelis
12.8
/100
|
#207
Poor
5.6%
Immigrants | Philippines
11.5
/100
|
#208
Poor
5.7%
French
10.8
/100
|
#209
Poor
5.7%
Whites/Caucasians
9.2
/100
|
#210
Tragic
5.7%
Spanish American Indians
8.7
/100
|
#211
Tragic
5.7%

Demographics Similar to Immigrants from Micronesia by Unemployment Among Ages 30 to 34 years

In terms of unemployment among ages 30 to 34 years, the demographic groups most similar to Immigrants from Micronesia are Subsaharan African (6.0%, a difference of 0.020%), Immigrants from Liberia (6.0%, a difference of 0.15%), Ghanaian (6.0%, a difference of 0.20%), Guatemalan (6.0%, a difference of 0.21%), and Nigerian (6.0%, a difference of 0.27%).
DemographicsRating | RankUnemployment Among Ages 30 to 34 years
Central Americans
0.6
/100
|
#237
Tragic
5.9%
Mexican American Indians
0.6
/100
|
#238
Tragic
5.9%
Immigrants | Nigeria
0.6
/100
|
#239
Tragic
6.0%
Salvadorans
0.5
/100
|
#240
Tragic
6.0%
Immigrants | El Salvador
0.5
/100
|
#241
Tragic
6.0%
Guatemalans
0.4
/100
|
#242
Tragic
6.0%
Immigrants | Liberia
0.4
/100
|
#243
Tragic
6.0%
Immigrants | Micronesia
0.3
/100
|
#244
Tragic
6.0%
Sub-Saharan Africans
0.3
/100
|
#245
Tragic
6.0%
Ghanaians
0.3
/100
|
#246
Tragic
6.0%
Nigerians
0.3
/100
|
#247
Tragic
6.0%
Immigrants | Guatemala
0.3
/100
|
#248
Tragic
6.0%
Hondurans
0.3
/100
|
#249
Tragic
6.0%
Immigrants | Honduras
0.3
/100
|
#250
Tragic
6.0%
Tlingit-Haida
0.2
/100
|
#251
Tragic
6.0%