Immigrants from Cambodia vs Latvian Unemployment Among Youth under 25 years
COMPARE
Immigrants from Cambodia
Latvian
Unemployment Among Youth under 25 years
Unemployment Among Youth under 25 years Comparison
Immigrants from Cambodia
Latvians
11.5%
UNEMPLOYMENT AMONG YOUTH UNDER 25 YEARS
71.8/ 100
METRIC RATING
149th/ 347
METRIC RANK
11.0%
UNEMPLOYMENT AMONG YOUTH UNDER 25 YEARS
99.0/ 100
METRIC RATING
52nd/ 347
METRIC RANK
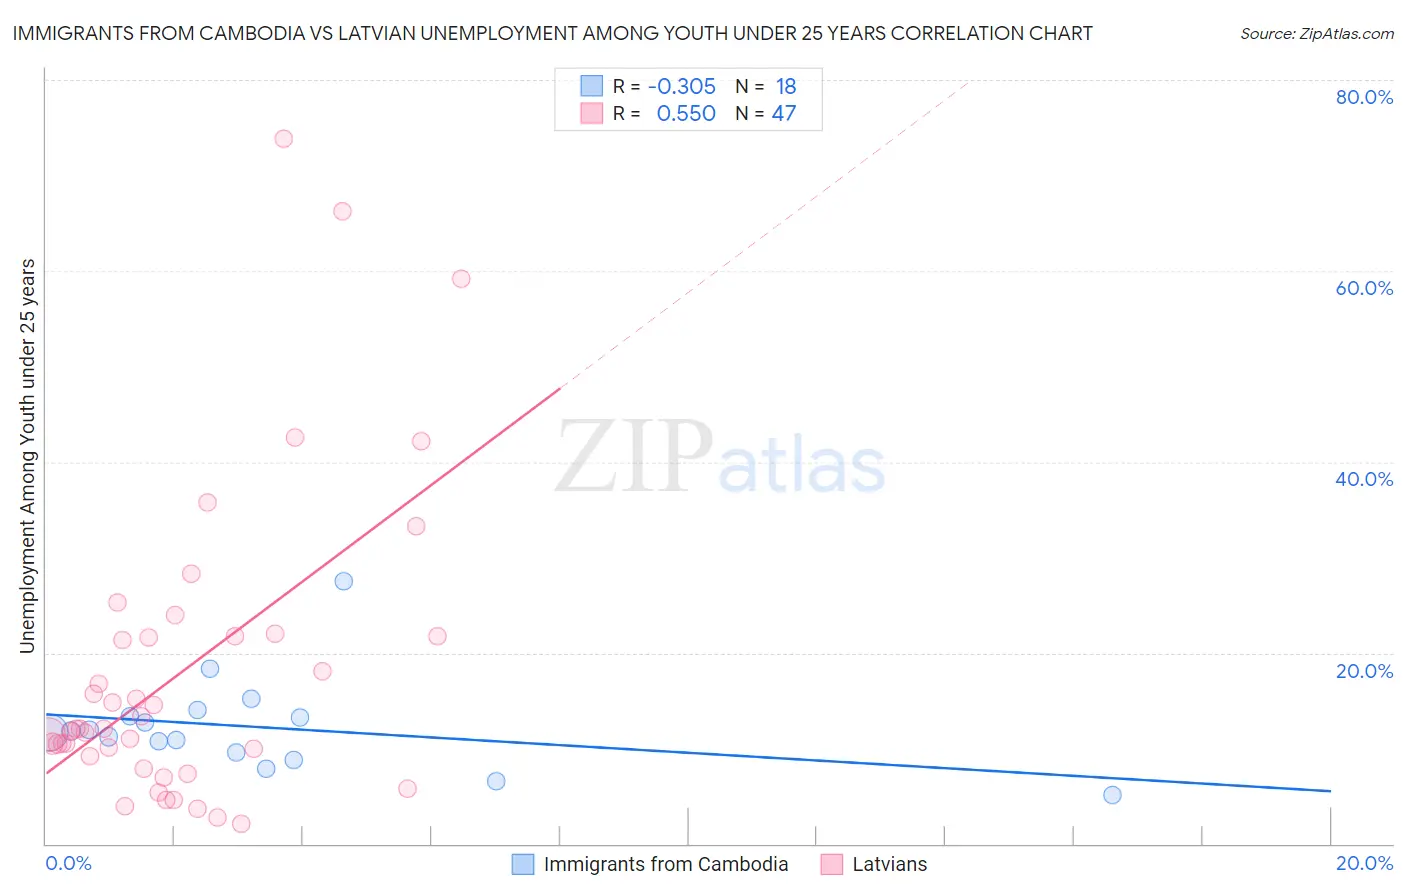
Immigrants from Cambodia vs Latvian Unemployment Among Youth under 25 years Correlation Chart
The statistical analysis conducted on geographies consisting of 204,519,643 people shows a mild negative correlation between the proportion of Immigrants from Cambodia and unemployment rate among youth under the age of 25 in the United States with a correlation coefficient (R) of -0.305 and weighted average of 11.5%. Similarly, the statistical analysis conducted on geographies consisting of 218,853,082 people shows a substantial positive correlation between the proportion of Latvians and unemployment rate among youth under the age of 25 in the United States with a correlation coefficient (R) of 0.550 and weighted average of 11.0%, a difference of 4.0%.
Unemployment Among Youth under 25 years Correlation Summary
| Measurement | Immigrants from Cambodia | Latvian |
| Minimum | 5.1% | 2.1% |
| Maximum | 27.5% | 73.8% |
| Range | 22.4% | 71.7% |
| Mean | 12.2% | 18.2% |
| Median | 11.7% | 12.1% |
| Interquartile 25% (IQ1) | 9.5% | 9.1% |
| Interquartile 75% (IQ3) | 13.3% | 21.8% |
| Interquartile Range (IQR) | 3.8% | 12.7% |
| Standard Deviation (Sample) | 4.9% | 16.0% |
| Standard Deviation (Population) | 4.8% | 15.8% |
Similar Demographics by Unemployment Among Youth under 25 years
Demographics Similar to Immigrants from Cambodia by Unemployment Among Youth under 25 years
In terms of unemployment among youth under 25 years, the demographic groups most similar to Immigrants from Cambodia are Immigrants from Northern Europe (11.5%, a difference of 0.010%), Immigrants from Switzerland (11.5%, a difference of 0.010%), Laotian (11.5%, a difference of 0.030%), Brazilian (11.5%, a difference of 0.040%), and Argentinean (11.5%, a difference of 0.060%).
| Demographics | Rating | Rank | Unemployment Among Youth under 25 years |
| Immigrants | Korea | 75.1 /100 | #142 | Good 11.5% |
| Immigrants | Uganda | 74.5 /100 | #143 | Good 11.5% |
| Immigrants | Brazil | 74.3 /100 | #144 | Good 11.5% |
| Argentineans | 73.0 /100 | #145 | Good 11.5% |
| Brazilians | 72.5 /100 | #146 | Good 11.5% |
| Laotians | 72.4 /100 | #147 | Good 11.5% |
| Immigrants | Northern Europe | 72.1 /100 | #148 | Good 11.5% |
| Immigrants | Cambodia | 71.8 /100 | #149 | Good 11.5% |
| Immigrants | Switzerland | 71.6 /100 | #150 | Good 11.5% |
| Uruguayans | 70.4 /100 | #151 | Good 11.5% |
| Iraqis | 68.3 /100 | #152 | Good 11.5% |
| Immigrants | Czechoslovakia | 67.1 /100 | #153 | Good 11.5% |
| Immigrants | Asia | 66.7 /100 | #154 | Good 11.5% |
| Immigrants | Romania | 66.3 /100 | #155 | Good 11.5% |
| Immigrants | Germany | 65.9 /100 | #156 | Good 11.5% |
Demographics Similar to Latvians by Unemployment Among Youth under 25 years
In terms of unemployment among youth under 25 years, the demographic groups most similar to Latvians are Serbian (11.0%, a difference of 0.020%), Ottawa (11.1%, a difference of 0.090%), Mongolian (11.1%, a difference of 0.17%), Irish (11.1%, a difference of 0.17%), and Immigrants from Saudi Arabia (11.1%, a difference of 0.20%).
| Demographics | Rating | Rank | Unemployment Among Youth under 25 years |
| Bulgarians | 99.6 /100 | #45 | Exceptional 10.9% |
| Tongans | 99.6 /100 | #46 | Exceptional 10.9% |
| Australians | 99.6 /100 | #47 | Exceptional 10.9% |
| Poles | 99.3 /100 | #48 | Exceptional 11.0% |
| Thais | 99.3 /100 | #49 | Exceptional 11.0% |
| Czechoslovakians | 99.2 /100 | #50 | Exceptional 11.0% |
| Serbians | 99.0 /100 | #51 | Exceptional 11.0% |
| Latvians | 99.0 /100 | #52 | Exceptional 11.0% |
| Ottawa | 99.0 /100 | #53 | Exceptional 11.1% |
| Mongolians | 98.9 /100 | #54 | Exceptional 11.1% |
| Irish | 98.9 /100 | #55 | Exceptional 11.1% |
| Immigrants | Saudi Arabia | 98.8 /100 | #56 | Exceptional 11.1% |
| Immigrants | Eritrea | 98.8 /100 | #57 | Exceptional 11.1% |
| Scotch-Irish | 98.8 /100 | #58 | Exceptional 11.1% |
| Immigrants | Eastern Africa | 98.7 /100 | #59 | Exceptional 11.1% |