Immigrants from Cambodia vs Immigrants from Sri Lanka Unemployment Among Ages 60 to 64 years
COMPARE
Immigrants from Cambodia
Immigrants from Sri Lanka
Unemployment Among Ages 60 to 64 years
Unemployment Among Ages 60 to 64 years Comparison
Immigrants from Cambodia
Immigrants from Sri Lanka
5.1%
UNEMPLOYMENT AMONG AGES 60 TO 64 YEARS
0.9/ 100
METRIC RATING
250th/ 347
METRIC RANK
4.7%
UNEMPLOYMENT AMONG AGES 60 TO 64 YEARS
98.9/ 100
METRIC RATING
85th/ 347
METRIC RANK
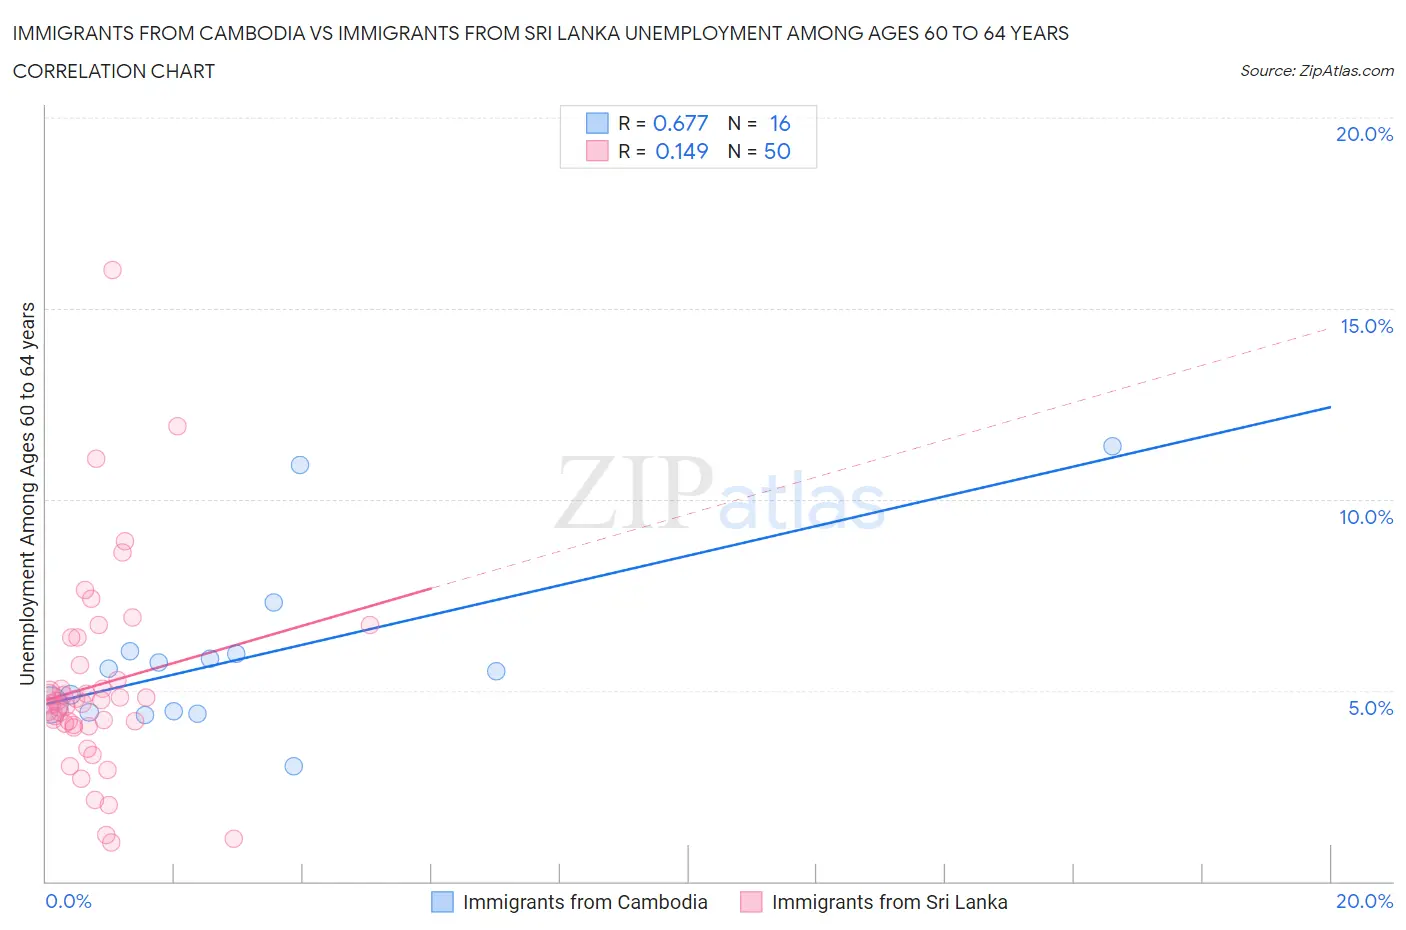
Immigrants from Cambodia vs Immigrants from Sri Lanka Unemployment Among Ages 60 to 64 years Correlation Chart
The statistical analysis conducted on geographies consisting of 196,033,881 people shows a significant positive correlation between the proportion of Immigrants from Cambodia and unemployment rate among population between the ages 60 and 64 in the United States with a correlation coefficient (R) of 0.677 and weighted average of 5.1%. Similarly, the statistical analysis conducted on geographies consisting of 144,593,097 people shows a poor positive correlation between the proportion of Immigrants from Sri Lanka and unemployment rate among population between the ages 60 and 64 in the United States with a correlation coefficient (R) of 0.149 and weighted average of 4.7%, a difference of 8.4%.
Unemployment Among Ages 60 to 64 years Correlation Summary
| Measurement | Immigrants from Cambodia | Immigrants from Sri Lanka |
| Minimum | 3.0% | 1.0% |
| Maximum | 11.4% | 16.0% |
| Range | 8.4% | 15.0% |
| Mean | 5.9% | 5.1% |
| Median | 5.5% | 4.7% |
| Interquartile 25% (IQ1) | 4.4% | 4.1% |
| Interquartile 75% (IQ3) | 6.0% | 5.7% |
| Interquartile Range (IQR) | 1.6% | 1.6% |
| Standard Deviation (Sample) | 2.3% | 2.7% |
| Standard Deviation (Population) | 2.2% | 2.6% |
Similar Demographics by Unemployment Among Ages 60 to 64 years
Demographics Similar to Immigrants from Cambodia by Unemployment Among Ages 60 to 64 years
In terms of unemployment among ages 60 to 64 years, the demographic groups most similar to Immigrants from Cambodia are Immigrants from Uruguay (5.1%, a difference of 0.030%), Immigrants from Switzerland (5.1%, a difference of 0.050%), Immigrants from China (5.1%, a difference of 0.080%), South American (5.1%, a difference of 0.10%), and Costa Rican (5.1%, a difference of 0.11%).
| Demographics | Rating | Rank | Unemployment Among Ages 60 to 64 years |
| Immigrants | Philippines | 1.9 /100 | #243 | Tragic 5.0% |
| Peruvians | 1.6 /100 | #244 | Tragic 5.0% |
| Comanche | 1.3 /100 | #245 | Tragic 5.0% |
| Immigrants | South America | 1.1 /100 | #246 | Tragic 5.0% |
| Immigrants | North Macedonia | 1.1 /100 | #247 | Tragic 5.0% |
| Immigrants | Fiji | 1.1 /100 | #248 | Tragic 5.1% |
| South Americans | 1.0 /100 | #249 | Tragic 5.1% |
| Immigrants | Cambodia | 0.9 /100 | #250 | Tragic 5.1% |
| Immigrants | Uruguay | 0.9 /100 | #251 | Tragic 5.1% |
| Immigrants | Switzerland | 0.9 /100 | #252 | Tragic 5.1% |
| Immigrants | China | 0.9 /100 | #253 | Tragic 5.1% |
| Costa Ricans | 0.8 /100 | #254 | Tragic 5.1% |
| Estonians | 0.8 /100 | #255 | Tragic 5.1% |
| Immigrants | Peru | 0.7 /100 | #256 | Tragic 5.1% |
| Japanese | 0.6 /100 | #257 | Tragic 5.1% |
Demographics Similar to Immigrants from Sri Lanka by Unemployment Among Ages 60 to 64 years
In terms of unemployment among ages 60 to 64 years, the demographic groups most similar to Immigrants from Sri Lanka are Thai (4.7%, a difference of 0.0%), Immigrants from Oceania (4.7%, a difference of 0.020%), Immigrants from Jordan (4.7%, a difference of 0.060%), Immigrants from Bulgaria (4.7%, a difference of 0.13%), and Immigrants from Northern Africa (4.7%, a difference of 0.13%).
| Demographics | Rating | Rank | Unemployment Among Ages 60 to 64 years |
| Seminole | 99.2 /100 | #78 | Exceptional 4.7% |
| Irish | 99.2 /100 | #79 | Exceptional 4.7% |
| Icelanders | 99.1 /100 | #80 | Exceptional 4.7% |
| Iroquois | 99.1 /100 | #81 | Exceptional 4.7% |
| Okinawans | 99.1 /100 | #82 | Exceptional 4.7% |
| Immigrants | Egypt | 99.1 /100 | #83 | Exceptional 4.7% |
| Thais | 98.9 /100 | #84 | Exceptional 4.7% |
| Immigrants | Sri Lanka | 98.9 /100 | #85 | Exceptional 4.7% |
| Immigrants | Oceania | 98.9 /100 | #86 | Exceptional 4.7% |
| Immigrants | Jordan | 98.8 /100 | #87 | Exceptional 4.7% |
| Immigrants | Bulgaria | 98.7 /100 | #88 | Exceptional 4.7% |
| Immigrants | Northern Africa | 98.7 /100 | #89 | Exceptional 4.7% |
| Immigrants | Liberia | 98.7 /100 | #90 | Exceptional 4.7% |
| Immigrants | Uganda | 98.4 /100 | #91 | Exceptional 4.7% |
| Romanians | 98.4 /100 | #92 | Exceptional 4.7% |