Immigrants from Cabo Verde vs Marshallese Unemployment Among Seniors over 75 years

COMPARE

Immigrants from Cabo Verde
Race
Ancestry
AfghanAfricanAlaska NativeAlaskan AthabascanAlbanianAleutAlsatianAmericanApacheArabArapahoArgentineanArmenianAssyrian/Chaldean/SyriacAustralianAustrianBahamianBangladeshiBarbadianBasqueBelgianBelizeanBermudanBhutaneseBlackfeetBolivianBrazilianBritishBritish West IndianBulgarianBurmeseCajunCambodianCanadianCape VerdeanCarpatho RusynCelticCentral AmericanCentral American IndianCherokeeCheyenneChickasawChileanChineseChippewaChoctawColombianColvilleComancheCosta RicanCreeCreekCroatianCrowCubanCypriotCzechCzechoslovakianDanishDelawareDominicanDutchDutch West IndianEastern EuropeanEcuadorianEgyptianEnglishEstonianEthiopianEuropeanFijianFilipinoFinnishFrenchFrench American IndianFrench CanadianGermanGerman RussianGhanaianGreekGuamanian/ChamorroGuatemalanGuyaneseHaitianHmongHonduranHopiHoumaHungarianIcelanderIndian (Asian)IndonesianInupiatIranianIraqiIrishIroquoisIsraeliItalianJamaicanJapaneseJordanianKenyanKiowaKoreanLaotianLatvianLebaneseLiberianLithuanianLumbeeLuxembourgerMacedonianMalaysianMalteseMexicanMexican American IndianMongolianMoroccanNative HawaiianNavajoNepaleseNew ZealanderNicaraguanNigerianNorthern EuropeanNorwegianOkinawanOsageOttawaPaiutePakistaniPalestinianPanamanianParaguayanPennsylvania GermanPeruvianPimaPolishPortuguesePotawatomiPuebloPuerto RicanPuget Sound SalishRomanianRussianSalvadoranSamoanScandinavianScotch-IrishScottishSeminoleSenegaleseSerbianShoshoneSierra LeoneanSiouxSlavicSlovakSloveneSomaliSouth AfricanSouth AmericanSouth American IndianSoviet UnionSpaniardSpanishSpanish AmericanSpanish American IndianSri LankanSubsaharan AfricanSudaneseSwedishSwissSyrianTaiwaneseThaiTlingit-HaidaTohono O'OdhamTonganTrinidadian and TobagonianTsimshianTurkishU.S. Virgin IslanderUgandanUkrainianUruguayanUteVenezuelanVietnameseWelshWest IndianYakamaYaquiYugoslavianYumanYup'ikZimbabwean
Immigration
NonimmigrantsImmigrantsAfghanistanAfricaAlbaniaArgentinaArmeniaAsiaAustraliaAustriaBahamasBangladeshBarbadosBelarusBelgiumBelizeBoliviaBosnia and HerzegovinaBrazilBulgariaBurma/MyanmarCabo VerdeCambodiaCameroonCanadaCaribbeanCentral AmericaChileChinaColombiaCongoCosta RicaCroatiaCubaCzechoslovakiaDenmarkDominicaDominican RepublicEastern AfricaEastern AsiaEastern EuropeEcuadorEgyptEl SalvadorEnglandEritreaEthiopiaEuropeFijiFranceGermanyGhanaGreeceGrenadaGuatemalaGuyanaHaitiHondurasHong KongHungaryIndiaIndonesiaIranIraqIrelandIsraelItalyJamaicaJapanJordanKazakhstanKenyaKoreaKuwaitLaosLatin AmericaLatviaLebanonLiberiaLithuaniaMalaysiaMexicoMicronesiaMiddle AfricaMoldovaMoroccoNepalNetherlandsNicaraguaNigeriaNorth AmericaNorth MacedoniaNorthern AfricaNorthern EuropeNorwayOceaniaPakistanPanamaPeruPhilippinesPolandPortugalRomaniaRussiaSaudi ArabiaScotlandSenegalSerbiaSierra LeoneSingaporeSomaliaSouth AfricaSouth AmericaSouth Central AsiaSouth Eastern AsiaSouthern EuropeSpainSri LankaSt. Vincent and the GrenadinesSudanSwedenSwitzerlandSyriaTaiwanThailandTrinidad and TobagoTurkeyUgandaUkraineUruguayUzbekistanVenezuelaVietnamWest IndiesWestern AfricaWestern AsiaWestern EuropeYemenZaireZimbabweAzores
Marshallese
Race
Ancestry
AfghanAfricanAlaska NativeAlaskan AthabascanAlbanianAleutAlsatianAmericanApacheArabArapahoArgentineanArmenianAssyrian/Chaldean/SyriacAustralianAustrianBahamianBangladeshiBarbadianBasqueBelgianBelizeanBermudanBhutaneseBlackfeetBolivianBrazilianBritishBritish West IndianBulgarianBurmeseCajunCambodianCanadianCape VerdeanCarpatho RusynCelticCentral AmericanCentral American IndianCherokeeCheyenneChickasawChileanChineseChippewaChoctawColombianColvilleComancheCosta RicanCreeCreekCroatianCrowCubanCypriotCzechCzechoslovakianDanishDelawareDominicanDutchDutch West IndianEastern EuropeanEcuadorianEgyptianEnglishEstonianEthiopianEuropeanFijianFilipinoFinnishFrenchFrench American IndianFrench CanadianGermanGerman RussianGhanaianGreekGuamanian/ChamorroGuatemalanGuyaneseHaitianHmongHonduranHopiHoumaHungarianIcelanderIndian (Asian)IndonesianInupiatIranianIraqiIrishIroquoisIsraeliItalianJamaicanJapaneseJordanianKenyanKiowaKoreanLaotianLatvianLebaneseLiberianLithuanianLumbeeLuxembourgerMacedonianMalaysianMalteseMarshalleseMexicanMexican American IndianMongolianMoroccanNative HawaiianNavajoNepaleseNew ZealanderNicaraguanNigerianNorthern EuropeanNorwegianOkinawanOsageOttawaPaiutePakistaniPalestinianPanamanianParaguayanPennsylvania GermanPeruvianPimaPolishPortuguesePotawatomiPuebloPuerto RicanPuget Sound SalishRomanianRussianSalvadoranSamoanScandinavianScotch-IrishScottishSeminoleSenegaleseSerbianShoshoneSierra LeoneanSiouxSlavicSlovakSloveneSomaliSouth AfricanSouth AmericanSouth American IndianSoviet UnionSpaniardSpanishSpanish AmericanSpanish American IndianSri LankanSubsaharan AfricanSudaneseSwedishSwissSyrianTaiwaneseThaiTlingit-HaidaTohono O'OdhamTonganTrinidadian and TobagonianTsimshianTurkishU.S. Virgin IslanderUgandanUkrainianUruguayanUteVenezuelanVietnameseWelshWest IndianYakamaYaquiYugoslavianYumanYup'ikZimbabwean
Immigration
NonimmigrantsImmigrantsAfghanistanAfricaAlbaniaArgentinaArmeniaAsiaAustraliaAustriaBahamasBangladeshBarbadosBelarusBelgiumBelizeBoliviaBosnia and HerzegovinaBrazilBulgariaBurma/MyanmarCambodiaCameroonCanadaCaribbeanCentral AmericaChileChinaColombiaCongoCosta RicaCroatiaCubaCzechoslovakiaDenmarkDominicaDominican RepublicEastern AfricaEastern AsiaEastern EuropeEcuadorEgyptEl SalvadorEnglandEritreaEthiopiaEuropeFijiFranceGermanyGhanaGreeceGrenadaGuatemalaGuyanaHaitiHondurasHong KongHungaryIndiaIndonesiaIranIraqIrelandIsraelItalyJamaicaJapanJordanKazakhstanKenyaKoreaKuwaitLaosLatin AmericaLatviaLebanonLiberiaLithuaniaMalaysiaMexicoMicronesiaMiddle AfricaMoldovaMoroccoNepalNetherlandsNicaraguaNigeriaNorth AmericaNorth MacedoniaNorthern AfricaNorthern EuropeNorwayOceaniaPakistanPanamaPeruPhilippinesPolandPortugalRomaniaRussiaSaudi ArabiaScotlandSenegalSerbiaSierra LeoneSingaporeSomaliaSouth AfricaSouth AmericaSouth Central AsiaSouth Eastern AsiaSouthern EuropeSpainSri LankaSt. Vincent and the GrenadinesSudanSwedenSwitzerlandSyriaTaiwanThailandTrinidad and TobagoTurkeyUgandaUkraineUruguayUzbekistanVenezuelaVietnamWest IndiesWestern AfricaWestern AsiaWestern EuropeYemenZaireZimbabweAzores
Unemployment Among Seniors over 75 years
Income
Poverty
Unemployment
Labor Participation
Family Structure
Vehicle Availability
Education Level
Disability

Unemployment Among Seniors over 75 years Comparison

Immigrants from Cabo Verde

Marshallese

Tragic
Exceptional
12.3%
UNEMPLOYMENT AMONG SENIORS OVER 75 YEARS
0.0/ 100
METRIC RATING
338th/ 347
METRIC RANK
8.2%
UNEMPLOYMENT AMONG SENIORS OVER 75 YEARS
98.7/ 100
METRIC RATING
110th/ 347
METRIC RANK

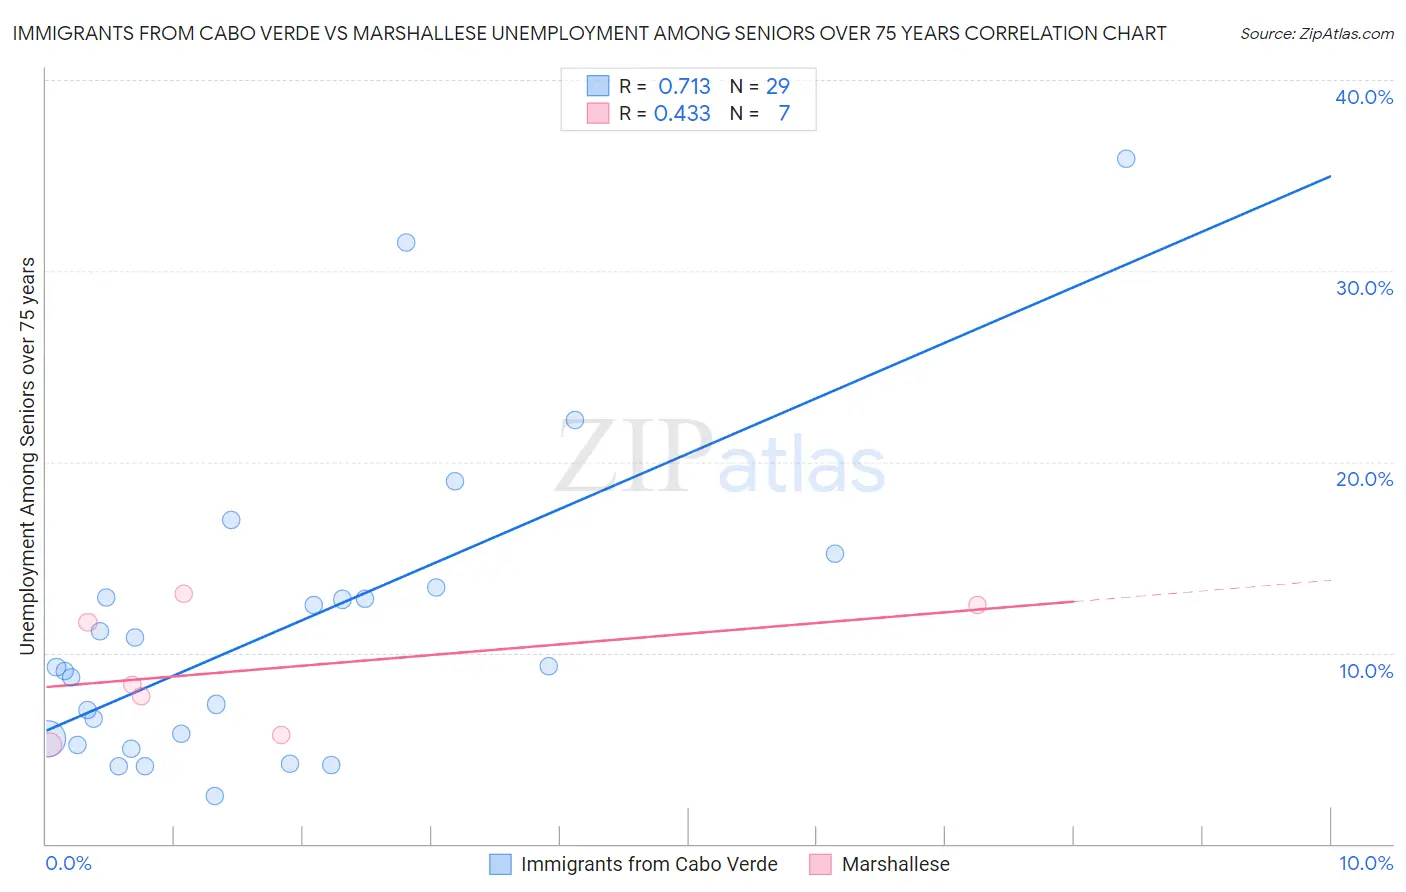
Immigrants from Cabo Verde vs Marshallese Unemployment Among Seniors over 75 years Correlation Chart

The statistical analysis conducted on geographies consisting of 29,962,388 people shows a strong positive correlation between the proportion of Immigrants from Cabo Verde and unemployment rate among seniors over the age of 75 in the United States with a correlation coefficient (R) of 0.713 and weighted average of 12.3%. Similarly, the statistical analysis conducted on geographies consisting of 10,692,551 people shows a moderate positive correlation between the proportion of Marshallese and unemployment rate among seniors over the age of 75 in the United States with a correlation coefficient (R) of 0.433 and weighted average of 8.2%, a difference of 49.7%.
Immigrants from Cabo Verde vs Marshallese Unemployment Among Seniors over 75 years

Unemployment Among Seniors over 75 years Correlation Summary

MeasurementImmigrants from Cabo VerdeMarshallese
Minimum2.5%5.2%
Maximum35.9%13.1%
Range33.4%7.9%
Mean11.2%9.2%
Median9.2%8.3%
Interquartile 25% (IQ1)5.3%5.7%
Interquartile 75% (IQ3)13.2%12.5%
Interquartile Range (IQR)7.8%6.8%
Standard Deviation (Sample)7.9%3.2%
Standard Deviation (Population)7.8%3.0%

Similar Demographics by Unemployment Among Seniors over 75 years

Demographics Similar to Immigrants from Cabo Verde by Unemployment Among Seniors over 75 years

In terms of unemployment among seniors over 75 years, the demographic groups most similar to Immigrants from Cabo Verde are Cajun (12.5%, a difference of 1.3%), Yup'ik (12.8%, a difference of 3.5%), Cape Verdean (11.4%, a difference of 8.1%), Immigrants from North Macedonia (11.3%, a difference of 9.0%), and Lumbee (13.5%, a difference of 9.2%).
DemographicsRating | RankUnemployment Among Seniors over 75 years
Tohono O'odham
0.0
/100
|
#331
Tragic
10.8%
Immigrants | Liberia
0.0
/100
|
#332
Tragic
10.9%
Alaskan Athabascans
0.0
/100
|
#333
Tragic
11.0%
Assyrians/Chaldeans/Syriacs
0.0
/100
|
#334
Tragic
11.1%
French Canadians
0.0
/100
|
#335
Tragic
11.2%
Immigrants | North Macedonia
0.0
/100
|
#336
Tragic
11.3%
Cape Verdeans
0.0
/100
|
#337
Tragic
11.4%
Immigrants | Cabo Verde
0.0
/100
|
#338
Tragic
12.3%
Cajuns
0.0
/100
|
#339
Tragic
12.5%
Yup'ik
0.0
/100
|
#340
Tragic
12.8%
Lumbee
0.0
/100
|
#341
Tragic
13.5%
Hmong
0.0
/100
|
#342
Tragic
13.7%
Alaska Natives
0.0
/100
|
#343
Tragic
14.7%
Immigrants | Yemen
0.0
/100
|
#344
Tragic
16.5%
Yakama
0.0
/100
|
#345
Tragic
18.4%

Demographics Similar to Marshallese by Unemployment Among Seniors over 75 years

In terms of unemployment among seniors over 75 years, the demographic groups most similar to Marshallese are Immigrants from Lebanon (8.2%, a difference of 0.030%), Laotian (8.2%, a difference of 0.050%), French American Indian (8.2%, a difference of 0.050%), Immigrants from India (8.2%, a difference of 0.17%), and Sri Lankan (8.2%, a difference of 0.18%).
DemographicsRating | RankUnemployment Among Seniors over 75 years
South American Indians
99.1
/100
|
#103
Exceptional
8.2%
Immigrants | South Central Asia
99.0
/100
|
#104
Exceptional
8.2%
Immigrants | Caribbean
99.0
/100
|
#105
Exceptional
8.2%
Immigrants | Honduras
99.0
/100
|
#106
Exceptional
8.2%
Sri Lankans
98.9
/100
|
#107
Exceptional
8.2%
Laotians
98.8
/100
|
#108
Exceptional
8.2%
Immigrants | Lebanon
98.8
/100
|
#109
Exceptional
8.2%
Marshallese
98.7
/100
|
#110
Exceptional
8.2%
French American Indians
98.7
/100
|
#111
Exceptional
8.2%
Immigrants | India
98.6
/100
|
#112
Exceptional
8.2%
Asians
98.5
/100
|
#113
Exceptional
8.3%
Trinidadians and Tobagonians
98.4
/100
|
#114
Exceptional
8.3%
Sudanese
98.2
/100
|
#115
Exceptional
8.3%
Immigrants | West Indies
98.1
/100
|
#116
Exceptional
8.3%
Immigrants | Greece
97.9
/100
|
#117
Exceptional
8.3%