Immigrants from Cabo Verde vs Kiowa Unemployment Among Youth under 25 years

COMPARE

Immigrants from Cabo Verde
Race
Ancestry
AfghanAfricanAlaska NativeAlaskan AthabascanAlbanianAleutAlsatianAmericanApacheArabArapahoArgentineanArmenianAssyrian/Chaldean/SyriacAustralianAustrianBahamianBangladeshiBarbadianBasqueBelgianBelizeanBermudanBhutaneseBlackfeetBolivianBrazilianBritishBritish West IndianBulgarianBurmeseCajunCambodianCanadianCape VerdeanCarpatho RusynCelticCentral AmericanCentral American IndianCherokeeCheyenneChickasawChileanChineseChippewaChoctawColombianColvilleComancheCosta RicanCreeCreekCroatianCrowCubanCypriotCzechCzechoslovakianDanishDelawareDominicanDutchDutch West IndianEastern EuropeanEcuadorianEgyptianEnglishEstonianEthiopianEuropeanFijianFilipinoFinnishFrenchFrench American IndianFrench CanadianGermanGerman RussianGhanaianGreekGuamanian/ChamorroGuatemalanGuyaneseHaitianHmongHonduranHopiHoumaHungarianIcelanderIndian (Asian)IndonesianInupiatIranianIraqiIrishIroquoisIsraeliItalianJamaicanJapaneseJordanianKenyanKoreanLaotianLatvianLebaneseLiberianLithuanianLumbeeLuxembourgerMacedonianMalaysianMalteseMarshalleseMenomineeMexicanMexican American IndianMongolianMoroccanNative HawaiianNavajoNepaleseNew ZealanderNicaraguanNigerianNorthern EuropeanNorwegianOkinawanOsageOttawaPaiutePakistaniPalestinianPanamanianParaguayanPennsylvania GermanPeruvianPimaPolishPortuguesePotawatomiPuebloPuerto RicanPuget Sound SalishRomanianRussianSalvadoranSamoanScandinavianScotch-IrishScottishSeminoleSenegaleseSerbianShoshoneSierra LeoneanSiouxSlavicSlovakSloveneSomaliSouth AfricanSouth AmericanSouth American IndianSoviet UnionSpaniardSpanishSpanish AmericanSpanish American IndianSri LankanSubsaharan AfricanSudaneseSwedishSwissSyrianTaiwaneseThaiTlingit-HaidaTohono O'OdhamTonganTrinidadian and TobagonianTsimshianTurkishU.S. Virgin IslanderUgandanUkrainianUruguayanUteVenezuelanVietnameseWelshWest IndianYakamaYaquiYugoslavianYumanYup'ikZimbabwean
Immigration
NonimmigrantsImmigrantsAfghanistanAfricaAlbaniaArgentinaArmeniaAsiaAustraliaAustriaBahamasBangladeshBarbadosBelarusBelgiumBelizeBoliviaBosnia and HerzegovinaBrazilBulgariaBurma/MyanmarCabo VerdeCambodiaCameroonCanadaCaribbeanCentral AmericaChileChinaColombiaCongoCosta RicaCroatiaCubaCzechoslovakiaDenmarkDominicaDominican RepublicEastern AfricaEastern AsiaEastern EuropeEcuadorEgyptEl SalvadorEnglandEritreaEthiopiaEuropeFijiFranceGermanyGhanaGreeceGrenadaGuatemalaGuyanaHaitiHondurasHong KongHungaryIndiaIndonesiaIranIraqIrelandIsraelItalyJamaicaJapanJordanKazakhstanKenyaKoreaKuwaitLaosLatin AmericaLatviaLebanonLiberiaLithuaniaMalaysiaMexicoMicronesiaMiddle AfricaMoldovaMoroccoNepalNetherlandsNicaraguaNigeriaNorth AmericaNorth MacedoniaNorthern AfricaNorthern EuropeNorwayOceaniaPakistanPanamaPeruPhilippinesPolandPortugalRomaniaRussiaSaudi ArabiaScotlandSenegalSerbiaSierra LeoneSingaporeSomaliaSouth AfricaSouth AmericaSouth Central AsiaSouth Eastern AsiaSouthern EuropeSpainSri LankaSt. Vincent and the GrenadinesSudanSwedenSwitzerlandSyriaTaiwanThailandTrinidad and TobagoTurkeyUgandaUkraineUruguayUzbekistanVenezuelaVietnamWest IndiesWestern AfricaWestern AsiaWestern EuropeYemenZaireZimbabweAzores
Kiowa
Race
Ancestry
AfghanAfricanAlaska NativeAlaskan AthabascanAlbanianAleutAlsatianAmericanApacheArabArapahoArgentineanArmenianAssyrian/Chaldean/SyriacAustralianAustrianBahamianBangladeshiBarbadianBasqueBelgianBelizeanBermudanBhutaneseBlackfeetBolivianBrazilianBritishBritish West IndianBulgarianBurmeseCajunCambodianCanadianCape VerdeanCarpatho RusynCelticCentral AmericanCentral American IndianCherokeeCheyenneChickasawChileanChineseChippewaChoctawColombianColvilleComancheCosta RicanCreeCreekCroatianCrowCubanCypriotCzechCzechoslovakianDanishDelawareDominicanDutchDutch West IndianEastern EuropeanEcuadorianEgyptianEnglishEstonianEthiopianEuropeanFijianFilipinoFinnishFrenchFrench American IndianFrench CanadianGermanGerman RussianGhanaianGreekGuamanian/ChamorroGuatemalanGuyaneseHaitianHmongHonduranHopiHoumaHungarianIcelanderIndian (Asian)IndonesianInupiatIranianIraqiIrishIroquoisIsraeliItalianJamaicanJapaneseJordanianKenyanKiowaKoreanLaotianLatvianLebaneseLiberianLithuanianLumbeeLuxembourgerMacedonianMalaysianMalteseMarshalleseMenomineeMexicanMexican American IndianMongolianMoroccanNative HawaiianNavajoNepaleseNew ZealanderNicaraguanNigerianNorthern EuropeanNorwegianOkinawanOsageOttawaPaiutePakistaniPalestinianPanamanianParaguayanPennsylvania GermanPeruvianPimaPolishPortuguesePotawatomiPuebloPuerto RicanPuget Sound SalishRomanianRussianSalvadoranSamoanScandinavianScotch-IrishScottishSeminoleSenegaleseSerbianShoshoneSierra LeoneanSiouxSlavicSlovakSloveneSomaliSouth AfricanSouth AmericanSouth American IndianSoviet UnionSpaniardSpanishSpanish AmericanSpanish American IndianSri LankanSubsaharan AfricanSudaneseSwedishSwissSyrianTaiwaneseThaiTlingit-HaidaTohono O'OdhamTonganTrinidadian and TobagonianTsimshianTurkishU.S. Virgin IslanderUgandanUkrainianUruguayanUteVenezuelanVietnameseWelshWest IndianYakamaYaquiYugoslavianYumanYup'ikZimbabwean
Immigration
NonimmigrantsImmigrantsAfghanistanAfricaAlbaniaArgentinaArmeniaAsiaAustraliaAustriaBahamasBangladeshBarbadosBelarusBelgiumBelizeBoliviaBosnia and HerzegovinaBrazilBulgariaBurma/MyanmarCambodiaCameroonCanadaCaribbeanCentral AmericaChileChinaColombiaCongoCosta RicaCroatiaCubaCzechoslovakiaDenmarkDominicaDominican RepublicEastern AfricaEastern AsiaEastern EuropeEcuadorEgyptEl SalvadorEnglandEritreaEthiopiaEuropeFijiFranceGermanyGhanaGreeceGrenadaGuatemalaGuyanaHaitiHondurasHong KongHungaryIndiaIndonesiaIranIraqIrelandIsraelItalyJamaicaJapanJordanKazakhstanKenyaKoreaKuwaitLaosLatin AmericaLatviaLebanonLiberiaLithuaniaMalaysiaMexicoMicronesiaMiddle AfricaMoldovaMoroccoNepalNetherlandsNicaraguaNigeriaNorth AmericaNorth MacedoniaNorthern AfricaNorthern EuropeNorwayOceaniaPakistanPanamaPeruPhilippinesPolandPortugalRomaniaRussiaSaudi ArabiaScotlandSenegalSerbiaSierra LeoneSingaporeSomaliaSouth AfricaSouth AmericaSouth Central AsiaSouth Eastern AsiaSouthern EuropeSpainSri LankaSt. Vincent and the GrenadinesSudanSwedenSwitzerlandSyriaTaiwanThailandTrinidad and TobagoTurkeyUgandaUkraineUruguayUzbekistanVenezuelaVietnamWest IndiesWestern AfricaWestern AsiaWestern EuropeYemenZaireZimbabweAzores
Unemployment Among Youth under 25 years
Income
Poverty
Unemployment
Labor Participation
Family Structure
Vehicle Availability
Education Level
Disability

Unemployment Among Youth under 25 years Comparison

Immigrants from Cabo Verde

Kiowa

Tragic
Tragic
13.8%
UNEMPLOYMENT AMONG YOUTH UNDER 25 YEARS
0.0/ 100
METRIC RATING
300th/ 347
METRIC RANK
12.7%
UNEMPLOYMENT AMONG YOUTH UNDER 25 YEARS
0.0/ 100
METRIC RATING
269th/ 347
METRIC RANK

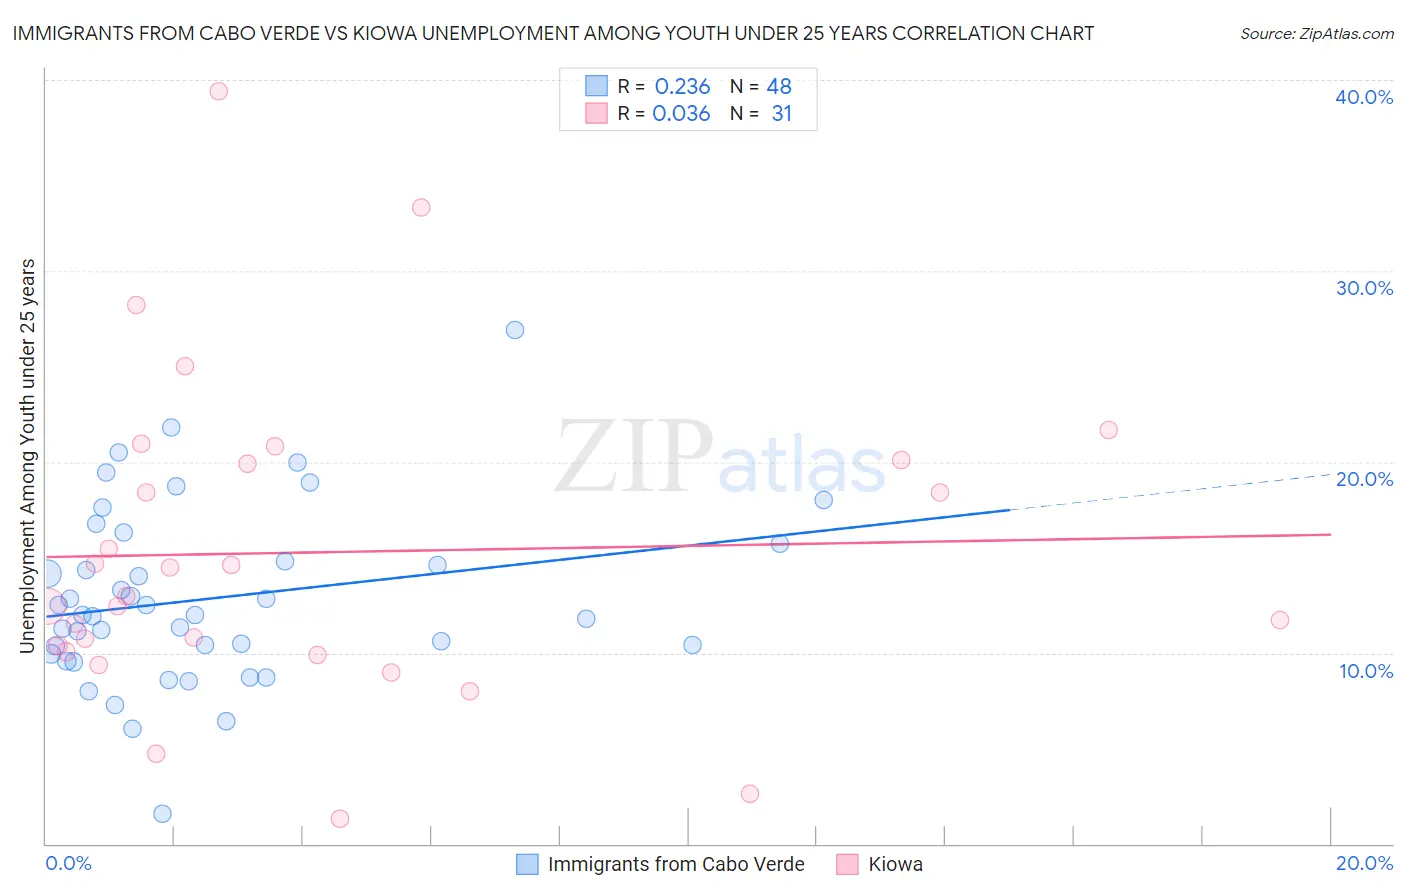
Immigrants from Cabo Verde vs Kiowa Unemployment Among Youth under 25 years Correlation Chart

The statistical analysis conducted on geographies consisting of 38,057,869 people shows a weak positive correlation between the proportion of Immigrants from Cabo Verde and unemployment rate among youth under the age of 25 in the United States with a correlation coefficient (R) of 0.236 and weighted average of 13.8%. Similarly, the statistical analysis conducted on geographies consisting of 55,922,493 people shows no correlation between the proportion of Kiowa and unemployment rate among youth under the age of 25 in the United States with a correlation coefficient (R) of 0.036 and weighted average of 12.7%, a difference of 8.9%.
Immigrants from Cabo Verde vs Kiowa Unemployment Among Youth under 25 years

Unemployment Among Youth under 25 years Correlation Summary

MeasurementImmigrants from Cabo VerdeKiowa
Minimum1.6%1.3%
Maximum26.9%39.4%
Range25.3%38.1%
Mean12.9%15.3%
Median12.0%12.9%
Interquartile 25% (IQ1)10.2%10.1%
Interquartile 75% (IQ3)15.2%20.1%
Interquartile Range (IQR)5.1%10.0%
Standard Deviation (Sample)4.6%8.4%
Standard Deviation (Population)4.6%8.2%

Similar Demographics by Unemployment Among Youth under 25 years

Demographics Similar to Immigrants from Cabo Verde by Unemployment Among Youth under 25 years

In terms of unemployment among youth under 25 years, the demographic groups most similar to Immigrants from Cabo Verde are Immigrants from Senegal (13.8%, a difference of 0.17%), Tohono O'odham (13.8%, a difference of 0.21%), Immigrants from Sierra Leone (13.8%, a difference of 0.22%), Belizean (13.8%, a difference of 0.25%), and Houma (13.8%, a difference of 0.26%).
DemographicsRating | RankUnemployment Among Youth under 25 years
Spanish American Indians
0.0
/100
|
#293
Tragic
13.5%
Immigrants | Caribbean
0.0
/100
|
#294
Tragic
13.5%
Chippewa
0.0
/100
|
#295
Tragic
13.5%
Senegalese
0.0
/100
|
#296
Tragic
13.5%
U.S. Virgin Islanders
0.0
/100
|
#297
Tragic
13.6%
Shoshone
0.0
/100
|
#298
Tragic
13.7%
Tohono O'odham
0.0
/100
|
#299
Tragic
13.8%
Immigrants | Cabo Verde
0.0
/100
|
#300
Tragic
13.8%
Immigrants | Senegal
0.0
/100
|
#301
Tragic
13.8%
Immigrants | Sierra Leone
0.0
/100
|
#302
Tragic
13.8%
Belizeans
0.0
/100
|
#303
Tragic
13.8%
Houma
0.0
/100
|
#304
Tragic
13.8%
Haitians
0.0
/100
|
#305
Tragic
13.9%
Pueblo
0.0
/100
|
#306
Tragic
13.9%
Immigrants | Haiti
0.0
/100
|
#307
Tragic
14.0%

Demographics Similar to Kiowa by Unemployment Among Youth under 25 years

In terms of unemployment among youth under 25 years, the demographic groups most similar to Kiowa are Tlingit-Haida (12.7%, a difference of 0.12%), Subsaharan African (12.6%, a difference of 0.20%), Immigrants from Latin America (12.6%, a difference of 0.34%), Immigrants from Liberia (12.8%, a difference of 1.1%), and Nepalese (12.5%, a difference of 1.2%).
DemographicsRating | RankUnemployment Among Youth under 25 years
Immigrants | Mexico
0.1
/100
|
#262
Tragic
12.4%
Cree
0.1
/100
|
#263
Tragic
12.4%
Puget Sound Salish
0.1
/100
|
#264
Tragic
12.5%
Nepalese
0.0
/100
|
#265
Tragic
12.5%
Immigrants | Latin America
0.0
/100
|
#266
Tragic
12.6%
Sub-Saharan Africans
0.0
/100
|
#267
Tragic
12.6%
Tlingit-Haida
0.0
/100
|
#268
Tragic
12.7%
Kiowa
0.0
/100
|
#269
Tragic
12.7%
Immigrants | Liberia
0.0
/100
|
#270
Tragic
12.8%
Immigrants | Bahamas
0.0
/100
|
#271
Tragic
12.9%
Cape Verdeans
0.0
/100
|
#272
Tragic
12.9%
Nigerians
0.0
/100
|
#273
Tragic
13.0%
Immigrants | Nigeria
0.0
/100
|
#274
Tragic
13.0%
Bermudans
0.0
/100
|
#275
Tragic
13.0%
Immigrants | Uzbekistan
0.0
/100
|
#276
Tragic
13.1%