Immigrants from Burma/Myanmar vs Chickasaw Unemployment Among Ages 16 to 19 years

COMPARE

Immigrants from Burma/Myanmar
Race
Ancestry
AfghanAfricanAlaska NativeAlaskan AthabascanAlbanianAleutAlsatianAmericanApacheArabArapahoArgentineanArmenianAssyrian/Chaldean/SyriacAustralianAustrianBahamianBangladeshiBarbadianBasqueBelgianBelizeanBermudanBhutaneseBlackfeetBolivianBrazilianBritishBritish West IndianBulgarianBurmeseCajunCambodianCanadianCape VerdeanCarpatho RusynCelticCentral AmericanCentral American IndianCherokeeCheyenneChileanChineseChippewaChoctawColombianColvilleComancheCosta RicanCreeCreekCroatianCrowCubanCypriotCzechCzechoslovakianDanishDelawareDominicanDutchDutch West IndianEastern EuropeanEcuadorianEgyptianEnglishEstonianEthiopianEuropeanFijianFilipinoFinnishFrenchFrench American IndianFrench CanadianGermanGerman RussianGhanaianGreekGuamanian/ChamorroGuatemalanGuyaneseHaitianHmongHonduranHopiHoumaHungarianIcelanderIndian (Asian)IndonesianInupiatIranianIraqiIrishIroquoisIsraeliItalianJamaicanJapaneseJordanianKenyanKiowaKoreanLaotianLatvianLebaneseLiberianLithuanianLumbeeLuxembourgerMacedonianMalaysianMalteseMarshalleseMenomineeMexicanMexican American IndianMongolianMoroccanNative HawaiianNavajoNepaleseNew ZealanderNicaraguanNigerianNorthern EuropeanNorwegianOkinawanOsageOttawaPaiutePakistaniPalestinianPanamanianParaguayanPennsylvania GermanPeruvianPimaPolishPortuguesePotawatomiPuebloPuerto RicanPuget Sound SalishRomanianRussianSalvadoranSamoanScandinavianScotch-IrishScottishSeminoleSenegaleseSerbianShoshoneSierra LeoneanSiouxSlavicSlovakSloveneSomaliSouth AfricanSouth AmericanSouth American IndianSoviet UnionSpaniardSpanishSpanish AmericanSpanish American IndianSri LankanSubsaharan AfricanSudaneseSwedishSwissSyrianTaiwaneseThaiTlingit-HaidaTohono O'OdhamTonganTrinidadian and TobagonianTsimshianTurkishU.S. Virgin IslanderUgandanUkrainianUruguayanUteVenezuelanVietnameseWelshWest IndianYakamaYaquiYugoslavianYumanYup'ikZimbabwean
Immigration
NonimmigrantsImmigrantsAfghanistanAfricaAlbaniaArgentinaArmeniaAsiaAustraliaAustriaBahamasBangladeshBarbadosBelarusBelgiumBelizeBoliviaBosnia and HerzegovinaBrazilBulgariaBurma/MyanmarCabo VerdeCambodiaCameroonCanadaCaribbeanCentral AmericaChileChinaColombiaCongoCosta RicaCroatiaCubaCzechoslovakiaDenmarkDominicaDominican RepublicEastern AfricaEastern AsiaEastern EuropeEcuadorEgyptEl SalvadorEnglandEritreaEthiopiaEuropeFijiFranceGermanyGhanaGreeceGrenadaGuatemalaGuyanaHaitiHondurasHong KongHungaryIndiaIndonesiaIranIraqIrelandIsraelItalyJamaicaJapanJordanKazakhstanKenyaKoreaKuwaitLaosLatin AmericaLatviaLebanonLiberiaLithuaniaMalaysiaMexicoMicronesiaMiddle AfricaMoldovaMoroccoNepalNetherlandsNicaraguaNigeriaNorth AmericaNorth MacedoniaNorthern AfricaNorthern EuropeNorwayOceaniaPakistanPanamaPeruPhilippinesPolandPortugalRomaniaRussiaSaudi ArabiaScotlandSenegalSerbiaSierra LeoneSingaporeSomaliaSouth AfricaSouth AmericaSouth Central AsiaSouth Eastern AsiaSouthern EuropeSpainSri LankaSt. Vincent and the GrenadinesSudanSwedenSwitzerlandSyriaTaiwanThailandTrinidad and TobagoTurkeyUgandaUkraineUruguayUzbekistanVenezuelaVietnamWest IndiesWestern AfricaWestern AsiaWestern EuropeYemenZaireZimbabweAzores
Chickasaw
Race
Ancestry
AfghanAfricanAlaska NativeAlaskan AthabascanAlbanianAleutAlsatianAmericanApacheArabArapahoArgentineanArmenianAssyrian/Chaldean/SyriacAustralianAustrianBahamianBangladeshiBarbadianBasqueBelgianBelizeanBermudanBhutaneseBlackfeetBolivianBrazilianBritishBritish West IndianBulgarianBurmeseCajunCambodianCanadianCape VerdeanCarpatho RusynCelticCentral AmericanCentral American IndianCherokeeCheyenneChickasawChileanChineseChippewaChoctawColombianColvilleComancheCosta RicanCreeCreekCroatianCrowCubanCypriotCzechCzechoslovakianDanishDelawareDominicanDutchDutch West IndianEastern EuropeanEcuadorianEgyptianEnglishEstonianEthiopianEuropeanFijianFilipinoFinnishFrenchFrench American IndianFrench CanadianGermanGerman RussianGhanaianGreekGuamanian/ChamorroGuatemalanGuyaneseHaitianHmongHonduranHopiHoumaHungarianIcelanderIndian (Asian)IndonesianInupiatIranianIraqiIrishIroquoisIsraeliItalianJamaicanJapaneseJordanianKenyanKiowaKoreanLaotianLatvianLebaneseLiberianLithuanianLumbeeLuxembourgerMacedonianMalaysianMalteseMarshalleseMenomineeMexicanMexican American IndianMongolianMoroccanNative HawaiianNavajoNepaleseNew ZealanderNicaraguanNigerianNorthern EuropeanNorwegianOkinawanOsageOttawaPaiutePakistaniPalestinianPanamanianParaguayanPennsylvania GermanPeruvianPimaPolishPortuguesePotawatomiPuebloPuerto RicanPuget Sound SalishRomanianRussianSalvadoranSamoanScandinavianScotch-IrishScottishSeminoleSenegaleseSerbianShoshoneSierra LeoneanSiouxSlavicSlovakSloveneSomaliSouth AfricanSouth AmericanSouth American IndianSoviet UnionSpaniardSpanishSpanish AmericanSpanish American IndianSri LankanSubsaharan AfricanSudaneseSwedishSwissSyrianTaiwaneseThaiTlingit-HaidaTohono O'OdhamTonganTrinidadian and TobagonianTsimshianTurkishU.S. Virgin IslanderUgandanUkrainianUruguayanUteVenezuelanVietnameseWelshWest IndianYakamaYaquiYugoslavianYumanYup'ikZimbabwean
Immigration
NonimmigrantsImmigrantsAfghanistanAfricaAlbaniaArgentinaArmeniaAsiaAustraliaAustriaBahamasBangladeshBarbadosBelarusBelgiumBelizeBoliviaBosnia and HerzegovinaBrazilBulgariaCabo VerdeCambodiaCameroonCanadaCaribbeanCentral AmericaChileChinaColombiaCongoCosta RicaCroatiaCubaCzechoslovakiaDenmarkDominicaDominican RepublicEastern AfricaEastern AsiaEastern EuropeEcuadorEgyptEl SalvadorEnglandEritreaEthiopiaEuropeFijiFranceGermanyGhanaGreeceGrenadaGuatemalaGuyanaHaitiHondurasHong KongHungaryIndiaIndonesiaIranIraqIrelandIsraelItalyJamaicaJapanJordanKazakhstanKenyaKoreaKuwaitLaosLatin AmericaLatviaLebanonLiberiaLithuaniaMalaysiaMexicoMicronesiaMiddle AfricaMoldovaMoroccoNepalNetherlandsNicaraguaNigeriaNorth AmericaNorth MacedoniaNorthern AfricaNorthern EuropeNorwayOceaniaPakistanPanamaPeruPhilippinesPolandPortugalRomaniaRussiaSaudi ArabiaScotlandSenegalSerbiaSierra LeoneSingaporeSomaliaSouth AfricaSouth AmericaSouth Central AsiaSouth Eastern AsiaSouthern EuropeSpainSri LankaSt. Vincent and the GrenadinesSudanSwedenSwitzerlandSyriaTaiwanThailandTrinidad and TobagoTurkeyUgandaUkraineUruguayUzbekistanVenezuelaVietnamWest IndiesWestern AfricaWestern AsiaWestern EuropeYemenZaireZimbabweAzores
Unemployment Among Ages 16 to 19 years
Income
Poverty
Unemployment
Labor Participation
Family Structure
Vehicle Availability
Education Level
Disability

Unemployment Among Ages 16 to 19 years Comparison

Immigrants from Burma/Myanmar

Chickasaw

Exceptional
Exceptional
15.6%
UNEMPLOYMENT AMONG AGES 16 TO 19 YEARS
100.0/ 100
METRIC RATING
13th/ 347
METRIC RANK
16.7%
UNEMPLOYMENT AMONG AGES 16 TO 19 YEARS
98.7/ 100
METRIC RATING
68th/ 347
METRIC RANK

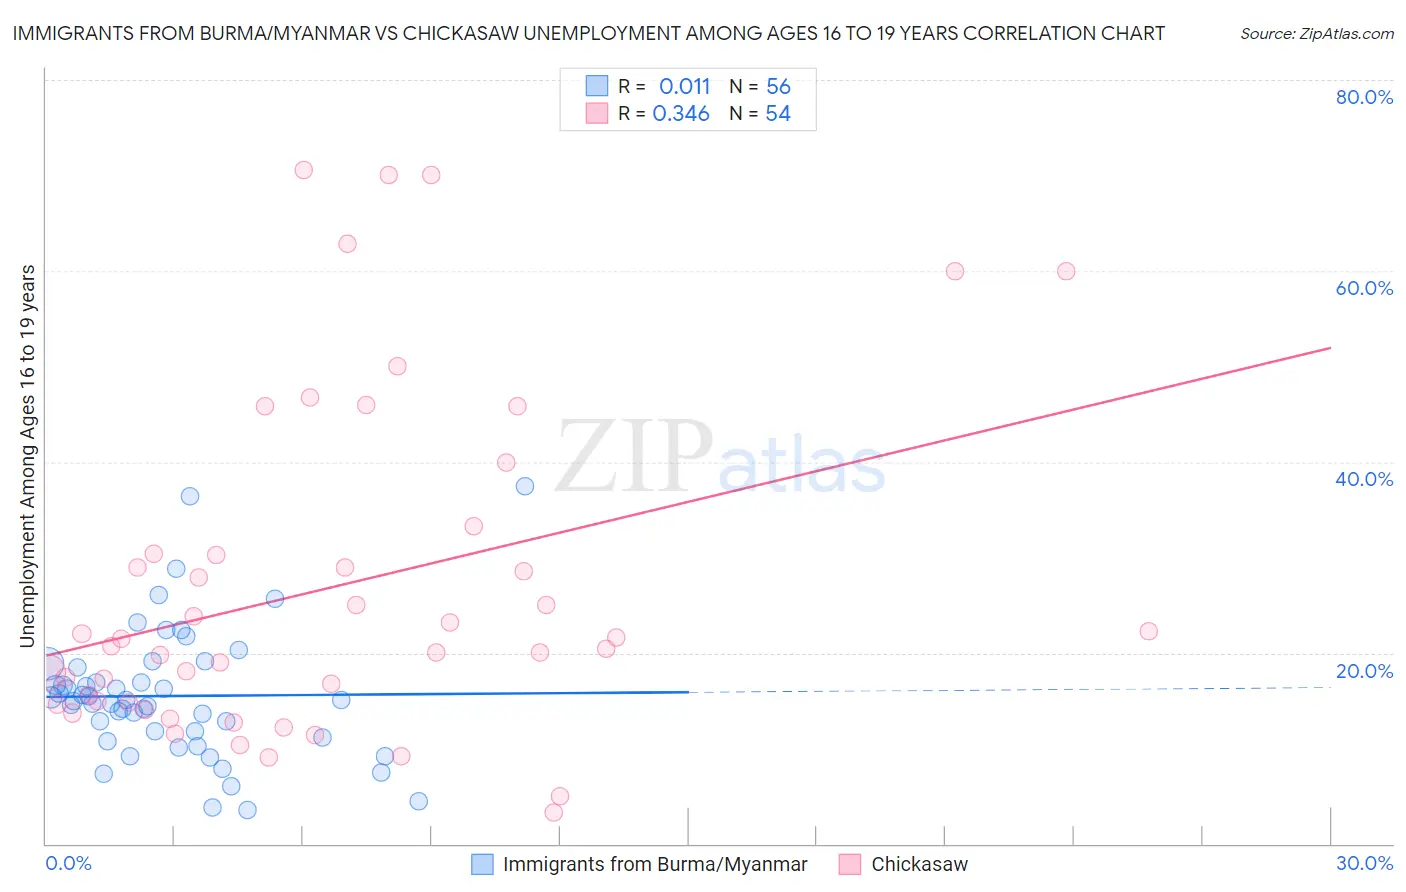
Immigrants from Burma/Myanmar vs Chickasaw Unemployment Among Ages 16 to 19 years Correlation Chart

The statistical analysis conducted on geographies consisting of 168,780,503 people shows no correlation between the proportion of Immigrants from Burma/Myanmar and unemployment rate among population between the ages 16 and 19 in the United States with a correlation coefficient (R) of 0.011 and weighted average of 15.6%. Similarly, the statistical analysis conducted on geographies consisting of 143,760,583 people shows a mild positive correlation between the proportion of Chickasaw and unemployment rate among population between the ages 16 and 19 in the United States with a correlation coefficient (R) of 0.346 and weighted average of 16.7%, a difference of 6.9%.
Immigrants from Burma/Myanmar vs Chickasaw Unemployment Among Ages 16 to 19 years

Unemployment Among Ages 16 to 19 years Correlation Summary

MeasurementImmigrants from Burma/MyanmarChickasaw
Minimum3.6%3.3%
Maximum37.5%70.5%
Range33.9%67.2%
Mean15.5%26.9%
Median15.0%21.1%
Interquartile 25% (IQ1)11.5%14.8%
Interquartile 75% (IQ3)17.7%30.3%
Interquartile Range (IQR)6.3%15.5%
Standard Deviation (Sample)6.8%17.5%
Standard Deviation (Population)6.7%17.3%

Similar Demographics by Unemployment Among Ages 16 to 19 years

Demographics Similar to Immigrants from Burma/Myanmar by Unemployment Among Ages 16 to 19 years

In terms of unemployment among ages 16 to 19 years, the demographic groups most similar to Immigrants from Burma/Myanmar are Immigrants from Zaire (15.6%, a difference of 0.14%), Yugoslavian (15.6%, a difference of 0.20%), Taiwanese (15.5%, a difference of 0.43%), German (15.7%, a difference of 0.49%), and Indonesian (15.5%, a difference of 0.53%).
DemographicsRating | RankUnemployment Among Ages 16 to 19 years
Swedes
100.0
/100
|
#6
Exceptional
15.3%
Immigrants | Bosnia and Herzegovina
100.0
/100
|
#7
Exceptional
15.3%
Czechs
100.0
/100
|
#8
Exceptional
15.4%
Scandinavians
100.0
/100
|
#9
Exceptional
15.4%
Zimbabweans
100.0
/100
|
#10
Exceptional
15.4%
Indonesians
100.0
/100
|
#11
Exceptional
15.5%
Taiwanese
100.0
/100
|
#12
Exceptional
15.5%
Immigrants | Burma/Myanmar
100.0
/100
|
#13
Exceptional
15.6%
Immigrants | Zaire
100.0
/100
|
#14
Exceptional
15.6%
Yugoslavians
100.0
/100
|
#15
Exceptional
15.6%
Germans
100.0
/100
|
#16
Exceptional
15.7%
Somalis
100.0
/100
|
#17
Exceptional
15.7%
Thais
100.0
/100
|
#18
Exceptional
15.7%
Swiss
100.0
/100
|
#19
Exceptional
15.8%
Sudanese
100.0
/100
|
#20
Exceptional
15.8%

Demographics Similar to Chickasaw by Unemployment Among Ages 16 to 19 years

In terms of unemployment among ages 16 to 19 years, the demographic groups most similar to Chickasaw are Slavic (16.7%, a difference of 0.0%), Serbian (16.7%, a difference of 0.070%), Austrian (16.7%, a difference of 0.14%), Okinawan (16.6%, a difference of 0.17%), and Immigrants from Japan (16.6%, a difference of 0.20%).
DemographicsRating | RankUnemployment Among Ages 16 to 19 years
Immigrants | Cuba
99.2
/100
|
#61
Exceptional
16.6%
Macedonians
99.2
/100
|
#62
Exceptional
16.6%
Scotch-Irish
99.1
/100
|
#63
Exceptional
16.6%
Northern Europeans
99.0
/100
|
#64
Exceptional
16.6%
Immigrants | Japan
98.9
/100
|
#65
Exceptional
16.6%
Okinawans
98.9
/100
|
#66
Exceptional
16.6%
Slavs
98.7
/100
|
#67
Exceptional
16.7%
Chickasaw
98.7
/100
|
#68
Exceptional
16.7%
Serbians
98.7
/100
|
#69
Exceptional
16.7%
Austrians
98.6
/100
|
#70
Exceptional
16.7%
Latvians
98.5
/100
|
#71
Exceptional
16.7%
Immigrants | Canada
98.5
/100
|
#72
Exceptional
16.7%
Lithuanians
98.2
/100
|
#73
Exceptional
16.7%
Immigrants | Eastern Africa
98.1
/100
|
#74
Exceptional
16.8%
New Zealanders
98.0
/100
|
#75
Exceptional
16.8%