Immigrants from Burma/Myanmar vs Black/African American Unemployment Among Ages 35 to 44 years
COMPARE
Immigrants from Burma/Myanmar
Black/African American
Unemployment Among Ages 35 to 44 years
Unemployment Among Ages 35 to 44 years Comparison
Immigrants from Burma/Myanmar
Blacks/African Americans
4.6%
UNEMPLOYMENT AMONG AGES 35 TO 44 YEARS
72.2/ 100
METRIC RATING
149th/ 347
METRIC RANK
6.1%
UNEMPLOYMENT AMONG AGES 35 TO 44 YEARS
0.0/ 100
METRIC RATING
315th/ 347
METRIC RANK
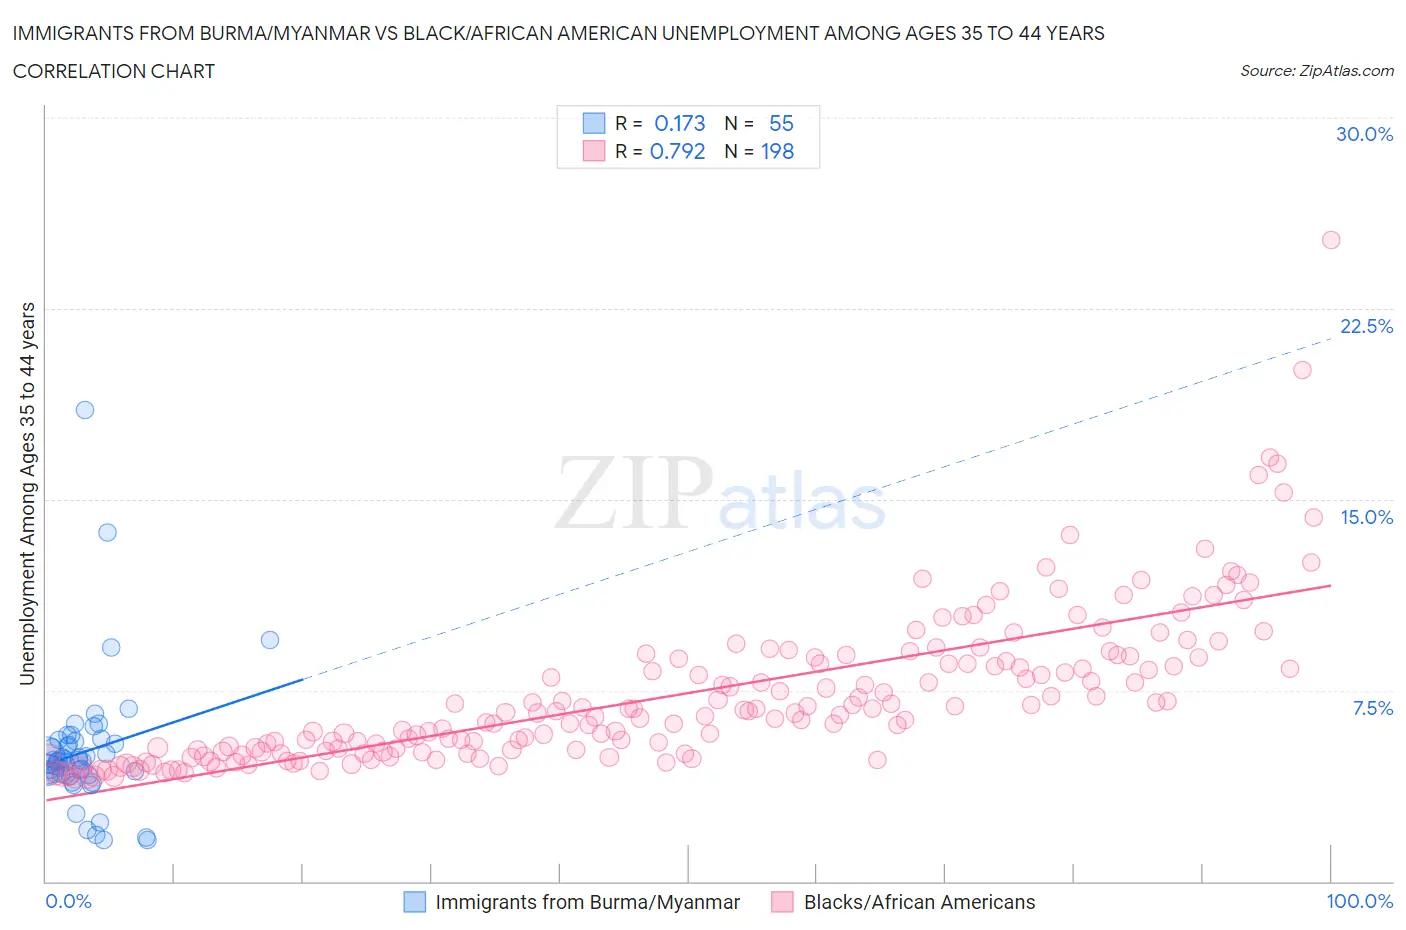
Immigrants from Burma/Myanmar vs Black/African American Unemployment Among Ages 35 to 44 years Correlation Chart
The statistical analysis conducted on geographies consisting of 171,415,766 people shows a poor positive correlation between the proportion of Immigrants from Burma/Myanmar and unemployment rate among population between the ages 35 and 44 in the United States with a correlation coefficient (R) of 0.173 and weighted average of 4.6%. Similarly, the statistical analysis conducted on geographies consisting of 531,599,324 people shows a strong positive correlation between the proportion of Blacks/African Americans and unemployment rate among population between the ages 35 and 44 in the United States with a correlation coefficient (R) of 0.792 and weighted average of 6.1%, a difference of 32.4%.
Unemployment Among Ages 35 to 44 years Correlation Summary
| Measurement | Immigrants from Burma/Myanmar | Black/African American |
| Minimum | 1.6% | 4.1% |
| Maximum | 18.5% | 25.2% |
| Range | 16.9% | 21.1% |
| Mean | 5.1% | 7.4% |
| Median | 4.7% | 6.6% |
| Interquartile 25% (IQ1) | 4.2% | 5.1% |
| Interquartile 75% (IQ3) | 5.5% | 8.7% |
| Interquartile Range (IQR) | 1.3% | 3.6% |
| Standard Deviation (Sample) | 2.7% | 3.1% |
| Standard Deviation (Population) | 2.7% | 3.0% |
Similar Demographics by Unemployment Among Ages 35 to 44 years
Demographics Similar to Immigrants from Burma/Myanmar by Unemployment Among Ages 35 to 44 years
In terms of unemployment among ages 35 to 44 years, the demographic groups most similar to Immigrants from Burma/Myanmar are Slavic (4.6%, a difference of 0.020%), Immigrants from Vietnam (4.6%, a difference of 0.14%), Immigrants from England (4.6%, a difference of 0.15%), Immigrants from Denmark (4.6%, a difference of 0.20%), and Immigrants from Eastern Europe (4.6%, a difference of 0.23%).
| Demographics | Rating | Rank | Unemployment Among Ages 35 to 44 years |
| Ukrainians | 75.8 /100 | #142 | Good 4.6% |
| Immigrants | Switzerland | 75.5 /100 | #143 | Good 4.6% |
| Immigrants | Russia | 75.4 /100 | #144 | Good 4.6% |
| Immigrants | Eastern Europe | 74.7 /100 | #145 | Good 4.6% |
| Immigrants | Denmark | 74.4 /100 | #146 | Good 4.6% |
| Immigrants | Vietnam | 73.8 /100 | #147 | Good 4.6% |
| Slavs | 72.4 /100 | #148 | Good 4.6% |
| Immigrants | Burma/Myanmar | 72.2 /100 | #149 | Good 4.6% |
| Immigrants | England | 70.5 /100 | #150 | Good 4.6% |
| Puget Sound Salish | 67.1 /100 | #151 | Good 4.6% |
| Pakistanis | 67.1 /100 | #152 | Good 4.6% |
| Immigrants | Brazil | 67.0 /100 | #153 | Good 4.6% |
| Immigrants | Western Europe | 65.5 /100 | #154 | Good 4.6% |
| Whites/Caucasians | 64.9 /100 | #155 | Good 4.6% |
| South Americans | 63.7 /100 | #156 | Good 4.6% |
Demographics Similar to Blacks/African Americans by Unemployment Among Ages 35 to 44 years
In terms of unemployment among ages 35 to 44 years, the demographic groups most similar to Blacks/African Americans are Tsimshian (6.2%, a difference of 0.85%), Immigrants from St. Vincent and the Grenadines (6.2%, a difference of 1.0%), Colville (6.2%, a difference of 1.5%), Immigrants from Grenada (6.2%, a difference of 1.7%), and Immigrants from Dominica (6.0%, a difference of 1.8%).
| Demographics | Rating | Rank | Unemployment Among Ages 35 to 44 years |
| Immigrants | Azores | 0.0 /100 | #308 | Tragic 5.8% |
| Immigrants | Barbados | 0.0 /100 | #309 | Tragic 5.8% |
| Guyanese | 0.0 /100 | #310 | Tragic 5.9% |
| Marshallese | 0.0 /100 | #311 | Tragic 5.9% |
| Immigrants | Guyana | 0.0 /100 | #312 | Tragic 6.0% |
| British West Indians | 0.0 /100 | #313 | Tragic 6.0% |
| Immigrants | Dominica | 0.0 /100 | #314 | Tragic 6.0% |
| Blacks/African Americans | 0.0 /100 | #315 | Tragic 6.1% |
| Tsimshian | 0.0 /100 | #316 | Tragic 6.2% |
| Immigrants | St. Vincent and the Grenadines | 0.0 /100 | #317 | Tragic 6.2% |
| Colville | 0.0 /100 | #318 | Tragic 6.2% |
| Immigrants | Grenada | 0.0 /100 | #319 | Tragic 6.2% |
| Immigrants | Armenia | 0.0 /100 | #320 | Tragic 6.2% |
| Chippewa | 0.0 /100 | #321 | Tragic 6.2% |
| Immigrants | Dominican Republic | 0.0 /100 | #322 | Tragic 6.4% |