Immigrants from Bulgaria vs Northern European Unemployment Among Seniors over 65 years

COMPARE

Immigrants from Bulgaria
Race
Ancestry
AfghanAfricanAlaska NativeAlaskan AthabascanAlbanianAleutAlsatianAmericanApacheArabArapahoArgentineanArmenianAssyrian/Chaldean/SyriacAustralianAustrianBahamianBangladeshiBarbadianBasqueBelgianBelizeanBermudanBhutaneseBlackfeetBolivianBrazilianBritishBritish West IndianBulgarianBurmeseCajunCambodianCanadianCape VerdeanCarpatho RusynCelticCentral AmericanCentral American IndianCherokeeCheyenneChickasawChileanChineseChippewaChoctawColombianColvilleComancheCosta RicanCreeCreekCroatianCrowCubanCypriotCzechCzechoslovakianDanishDelawareDominicanDutchDutch West IndianEastern EuropeanEcuadorianEgyptianEnglishEstonianEthiopianEuropeanFijianFilipinoFinnishFrenchFrench American IndianFrench CanadianGermanGerman RussianGhanaianGreekGuamanian/ChamorroGuatemalanGuyaneseHaitianHmongHonduranHopiHoumaHungarianIcelanderIndian (Asian)IndonesianInupiatIranianIraqiIrishIroquoisIsraeliItalianJamaicanJapaneseJordanianKenyanKiowaKoreanLaotianLatvianLebaneseLiberianLithuanianLumbeeLuxembourgerMacedonianMalaysianMalteseMarshalleseMenomineeMexicanMexican American IndianMongolianMoroccanNative HawaiianNavajoNepaleseNew ZealanderNicaraguanNigerianNorwegianOkinawanOsageOttawaPaiutePakistaniPalestinianPanamanianParaguayanPennsylvania GermanPeruvianPimaPolishPortuguesePotawatomiPuebloPuerto RicanPuget Sound SalishRomanianRussianSalvadoranSamoanScandinavianScotch-IrishScottishSeminoleSenegaleseSerbianShoshoneSierra LeoneanSiouxSlavicSlovakSloveneSomaliSouth AfricanSouth AmericanSouth American IndianSoviet UnionSpaniardSpanishSpanish AmericanSpanish American IndianSri LankanSubsaharan AfricanSudaneseSwedishSwissSyrianTaiwaneseThaiTlingit-HaidaTohono O'OdhamTonganTrinidadian and TobagonianTsimshianTurkishU.S. Virgin IslanderUgandanUkrainianUruguayanUteVenezuelanVietnameseWelshWest IndianYakamaYaquiYugoslavianYumanYup'ikZimbabwean
Immigration
NonimmigrantsImmigrantsAfghanistanAfricaAlbaniaArgentinaArmeniaAsiaAustraliaAustriaBahamasBangladeshBarbadosBelarusBelgiumBelizeBoliviaBosnia and HerzegovinaBrazilBulgariaBurma/MyanmarCabo VerdeCambodiaCameroonCanadaCaribbeanCentral AmericaChileChinaColombiaCongoCosta RicaCroatiaCubaCzechoslovakiaDenmarkDominicaDominican RepublicEastern AfricaEastern AsiaEastern EuropeEcuadorEgyptEl SalvadorEnglandEritreaEthiopiaEuropeFijiFranceGermanyGhanaGreeceGrenadaGuatemalaGuyanaHaitiHondurasHong KongHungaryIndiaIndonesiaIranIraqIrelandIsraelItalyJamaicaJapanJordanKazakhstanKenyaKoreaKuwaitLaosLatin AmericaLatviaLebanonLiberiaLithuaniaMalaysiaMexicoMicronesiaMiddle AfricaMoldovaMoroccoNepalNetherlandsNicaraguaNigeriaNorth AmericaNorth MacedoniaNorthern AfricaNorthern EuropeNorwayOceaniaPakistanPanamaPeruPhilippinesPolandPortugalRomaniaRussiaSaudi ArabiaScotlandSenegalSerbiaSierra LeoneSingaporeSomaliaSouth AfricaSouth AmericaSouth Central AsiaSouth Eastern AsiaSouthern EuropeSpainSri LankaSt. Vincent and the GrenadinesSudanSwedenSwitzerlandSyriaTaiwanThailandTrinidad and TobagoTurkeyUgandaUkraineUruguayUzbekistanVenezuelaVietnamWest IndiesWestern AfricaWestern AsiaWestern EuropeYemenZaireZimbabweAzores
Northern European
Race
Ancestry
AfghanAfricanAlaska NativeAlaskan AthabascanAlbanianAleutAlsatianAmericanApacheArabArapahoArgentineanArmenianAssyrian/Chaldean/SyriacAustralianAustrianBahamianBangladeshiBarbadianBasqueBelgianBelizeanBermudanBhutaneseBlackfeetBolivianBrazilianBritishBritish West IndianBulgarianBurmeseCajunCambodianCanadianCape VerdeanCarpatho RusynCelticCentral AmericanCentral American IndianCherokeeCheyenneChickasawChileanChineseChippewaChoctawColombianColvilleComancheCosta RicanCreeCreekCroatianCrowCubanCypriotCzechCzechoslovakianDanishDelawareDominicanDutchDutch West IndianEastern EuropeanEcuadorianEgyptianEnglishEstonianEthiopianEuropeanFijianFilipinoFinnishFrenchFrench American IndianFrench CanadianGermanGerman RussianGhanaianGreekGuamanian/ChamorroGuatemalanGuyaneseHaitianHmongHonduranHopiHoumaHungarianIcelanderIndian (Asian)IndonesianInupiatIranianIraqiIrishIroquoisIsraeliItalianJamaicanJapaneseJordanianKenyanKiowaKoreanLaotianLatvianLebaneseLiberianLithuanianLumbeeLuxembourgerMacedonianMalaysianMalteseMarshalleseMenomineeMexicanMexican American IndianMongolianMoroccanNative HawaiianNavajoNepaleseNew ZealanderNicaraguanNigerianNorthern EuropeanNorwegianOkinawanOsageOttawaPaiutePakistaniPalestinianPanamanianParaguayanPennsylvania GermanPeruvianPimaPolishPortuguesePotawatomiPuebloPuerto RicanPuget Sound SalishRomanianRussianSalvadoranSamoanScandinavianScotch-IrishScottishSeminoleSenegaleseSerbianShoshoneSierra LeoneanSiouxSlavicSlovakSloveneSomaliSouth AfricanSouth AmericanSouth American IndianSoviet UnionSpaniardSpanishSpanish AmericanSpanish American IndianSri LankanSubsaharan AfricanSudaneseSwedishSwissSyrianTaiwaneseThaiTlingit-HaidaTohono O'OdhamTonganTrinidadian and TobagonianTsimshianTurkishU.S. Virgin IslanderUgandanUkrainianUruguayanUteVenezuelanVietnameseWelshWest IndianYakamaYaquiYugoslavianYumanYup'ikZimbabwean
Immigration
NonimmigrantsImmigrantsAfghanistanAfricaAlbaniaArgentinaArmeniaAsiaAustraliaAustriaBahamasBangladeshBarbadosBelarusBelgiumBelizeBoliviaBosnia and HerzegovinaBrazilBurma/MyanmarCabo VerdeCambodiaCameroonCanadaCaribbeanCentral AmericaChileChinaColombiaCongoCosta RicaCroatiaCubaCzechoslovakiaDenmarkDominicaDominican RepublicEastern AfricaEastern AsiaEastern EuropeEcuadorEgyptEl SalvadorEnglandEritreaEthiopiaEuropeFijiFranceGermanyGhanaGreeceGrenadaGuatemalaGuyanaHaitiHondurasHong KongHungaryIndiaIndonesiaIranIraqIrelandIsraelItalyJamaicaJapanJordanKazakhstanKenyaKoreaKuwaitLaosLatin AmericaLatviaLebanonLiberiaLithuaniaMalaysiaMexicoMicronesiaMiddle AfricaMoldovaMoroccoNepalNetherlandsNicaraguaNigeriaNorth AmericaNorth MacedoniaNorthern AfricaNorthern EuropeNorwayOceaniaPakistanPanamaPeruPhilippinesPolandPortugalRomaniaRussiaSaudi ArabiaScotlandSenegalSerbiaSierra LeoneSingaporeSomaliaSouth AfricaSouth AmericaSouth Central AsiaSouth Eastern AsiaSouthern EuropeSpainSri LankaSt. Vincent and the GrenadinesSudanSwedenSwitzerlandSyriaTaiwanThailandTrinidad and TobagoTurkeyUgandaUkraineUruguayUzbekistanVenezuelaVietnamWest IndiesWestern AfricaWestern AsiaWestern EuropeYemenZaireZimbabweAzores
Unemployment Among Seniors over 65 years
Income
Poverty
Unemployment
Labor Participation
Family Structure
Vehicle Availability
Education Level
Disability

Unemployment Among Seniors over 65 years Comparison

Immigrants from Bulgaria

Northern Europeans

Exceptional
Exceptional
5.0%
UNEMPLOYMENT AMONG SENIORS OVER 65 YEARS
97.3/ 100
METRIC RATING
92nd/ 347
METRIC RANK
4.9%
UNEMPLOYMENT AMONG SENIORS OVER 65 YEARS
99.7/ 100
METRIC RATING
61st/ 347
METRIC RANK

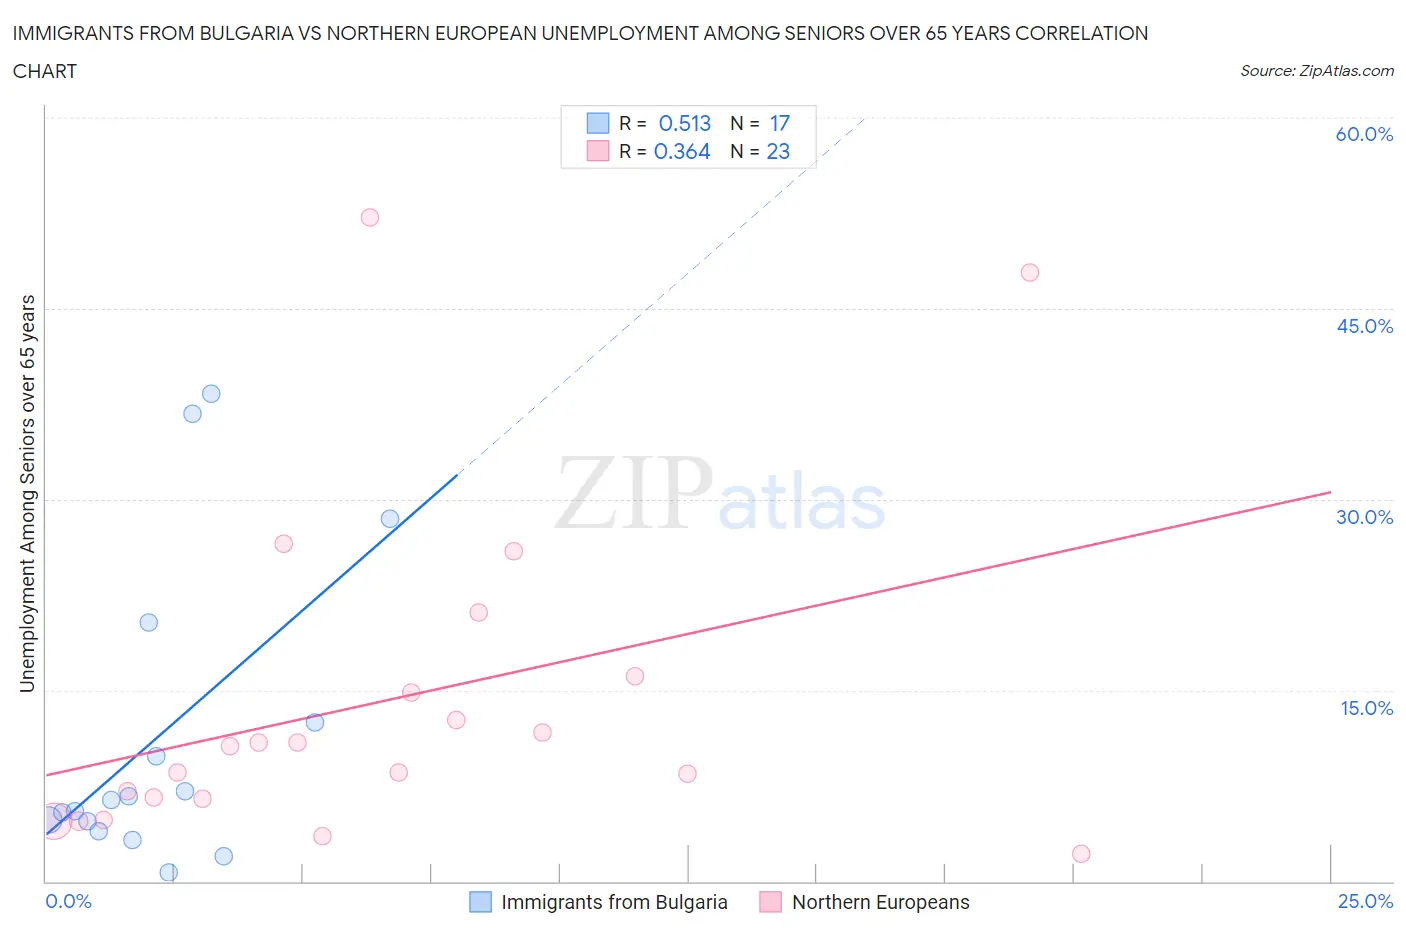
Immigrants from Bulgaria vs Northern European Unemployment Among Seniors over 65 years Correlation Chart

The statistical analysis conducted on geographies consisting of 165,167,478 people shows a substantial positive correlation between the proportion of Immigrants from Bulgaria and unemployment rate amomg seniors over the age of 65 in the United States with a correlation coefficient (R) of 0.513 and weighted average of 5.0%. Similarly, the statistical analysis conducted on geographies consisting of 358,323,734 people shows a mild positive correlation between the proportion of Northern Europeans and unemployment rate amomg seniors over the age of 65 in the United States with a correlation coefficient (R) of 0.364 and weighted average of 4.9%, a difference of 1.9%.
Immigrants from Bulgaria vs Northern European Unemployment Among Seniors over 65 years

Unemployment Among Seniors over 65 years Correlation Summary

MeasurementImmigrants from BulgariaNorthern European
Minimum0.70%2.2%
Maximum38.3%52.1%
Range37.6%49.9%
Mean11.6%14.2%
Median6.4%10.6%
Interquartile 25% (IQ1)4.3%6.5%
Interquartile 75% (IQ3)16.4%16.1%
Interquartile Range (IQR)12.1%9.6%
Standard Deviation (Sample)12.0%13.0%
Standard Deviation (Population)11.6%12.7%

Similar Demographics by Unemployment Among Seniors over 65 years

Demographics Similar to Immigrants from Bulgaria by Unemployment Among Seniors over 65 years

In terms of unemployment among seniors over 65 years, the demographic groups most similar to Immigrants from Bulgaria are Austrian (5.0%, a difference of 0.0%), Immigrants from Bolivia (5.0%, a difference of 0.020%), Immigrants from South Africa (5.0%, a difference of 0.10%), Immigrants from South Central Asia (5.0%, a difference of 0.11%), and Afghan (5.0%, a difference of 0.12%).
DemographicsRating | RankUnemployment Among Seniors over 65 years
Immigrants | Hungary
98.2
/100
|
#85
Exceptional
5.0%
Immigrants | Taiwan
98.2
/100
|
#86
Exceptional
5.0%
Immigrants | Switzerland
98.2
/100
|
#87
Exceptional
5.0%
Afghans
97.6
/100
|
#88
Exceptional
5.0%
Immigrants | South Central Asia
97.6
/100
|
#89
Exceptional
5.0%
Immigrants | South Africa
97.6
/100
|
#90
Exceptional
5.0%
Immigrants | Bolivia
97.3
/100
|
#91
Exceptional
5.0%
Immigrants | Bulgaria
97.3
/100
|
#92
Exceptional
5.0%
Austrians
97.3
/100
|
#93
Exceptional
5.0%
Burmese
96.8
/100
|
#94
Exceptional
5.0%
Assyrians/Chaldeans/Syriacs
96.8
/100
|
#95
Exceptional
5.0%
Immigrants | Singapore
96.8
/100
|
#96
Exceptional
5.0%
Immigrants | Oceania
96.8
/100
|
#97
Exceptional
5.0%
Czechoslovakians
96.7
/100
|
#98
Exceptional
5.0%
South Africans
96.5
/100
|
#99
Exceptional
5.0%

Demographics Similar to Northern Europeans by Unemployment Among Seniors over 65 years

In terms of unemployment among seniors over 65 years, the demographic groups most similar to Northern Europeans are Immigrants from Middle Africa (4.9%, a difference of 0.10%), Immigrants from Eastern Africa (4.9%, a difference of 0.11%), Latvian (4.9%, a difference of 0.18%), Croatian (4.9%, a difference of 0.20%), and Immigrants from Cambodia (4.9%, a difference of 0.20%).
DemographicsRating | RankUnemployment Among Seniors over 65 years
Immigrants | Iraq
99.8
/100
|
#54
Exceptional
4.9%
Europeans
99.8
/100
|
#55
Exceptional
4.9%
Carpatho Rusyns
99.8
/100
|
#56
Exceptional
4.9%
Danes
99.8
/100
|
#57
Exceptional
4.9%
Scandinavians
99.8
/100
|
#58
Exceptional
4.9%
Immigrants | Eastern Africa
99.7
/100
|
#59
Exceptional
4.9%
Immigrants | Middle Africa
99.7
/100
|
#60
Exceptional
4.9%
Northern Europeans
99.7
/100
|
#61
Exceptional
4.9%
Latvians
99.6
/100
|
#62
Exceptional
4.9%
Croatians
99.6
/100
|
#63
Exceptional
4.9%
Immigrants | Cambodia
99.6
/100
|
#64
Exceptional
4.9%
Immigrants | Nicaragua
99.6
/100
|
#65
Exceptional
4.9%
English
99.5
/100
|
#66
Exceptional
4.9%
Iroquois
99.5
/100
|
#67
Exceptional
4.9%
Bolivians
99.5
/100
|
#68
Exceptional
4.9%