Immigrants from Bulgaria vs Burmese Unemployment Among Ages 55 to 59 years
COMPARE
Immigrants from Bulgaria
Burmese
Unemployment Among Ages 55 to 59 years
Unemployment Among Ages 55 to 59 years Comparison
Immigrants from Bulgaria
Burmese
4.5%
UNEMPLOYMENT AMONG AGES 55 TO 59 YEARS
99.9/ 100
METRIC RATING
37th/ 347
METRIC RANK
4.5%
UNEMPLOYMENT AMONG AGES 55 TO 59 YEARS
99.7/ 100
METRIC RATING
54th/ 347
METRIC RANK
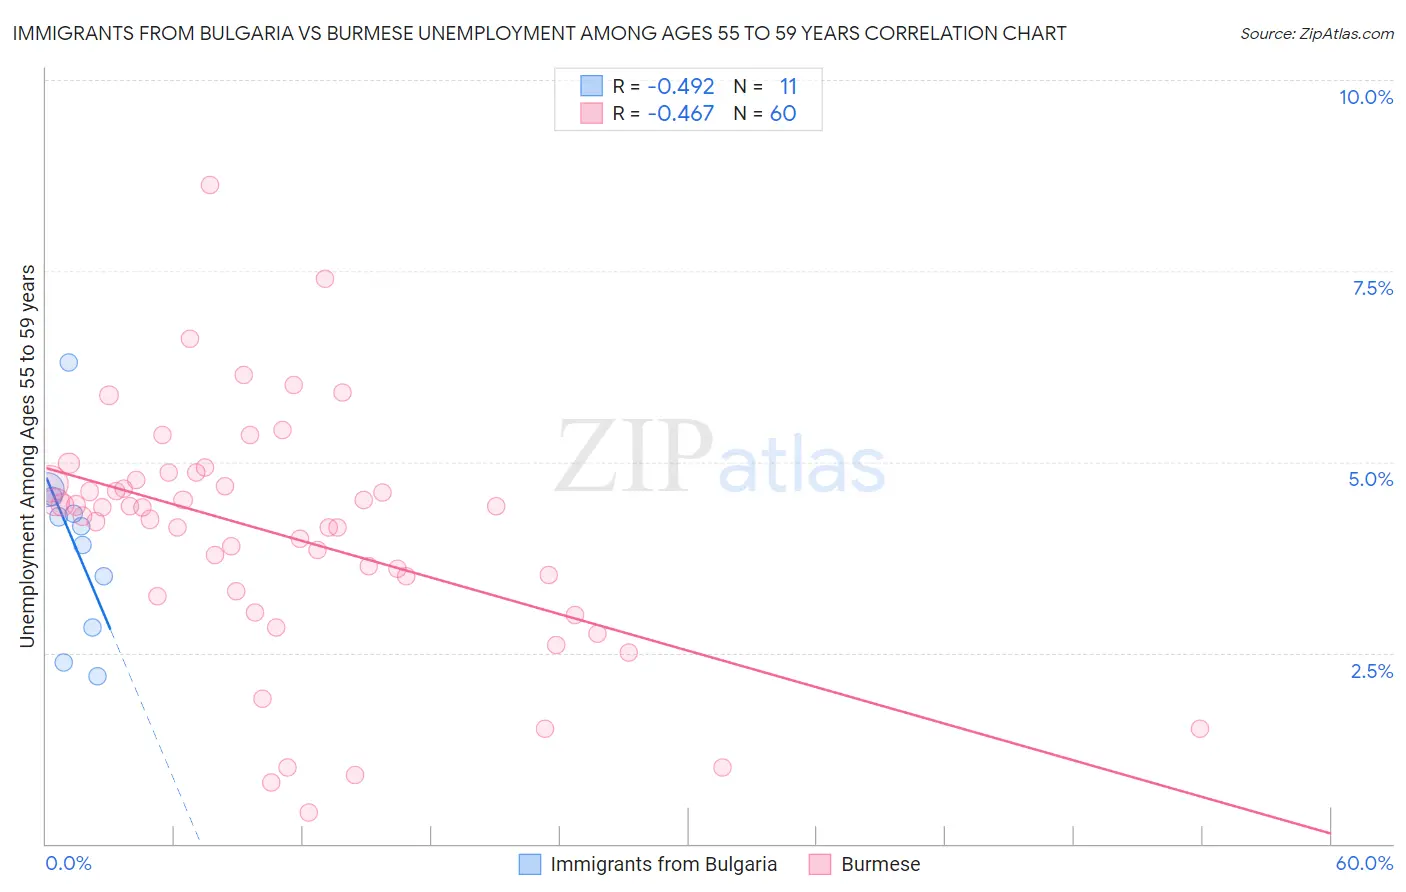
Immigrants from Bulgaria vs Burmese Unemployment Among Ages 55 to 59 years Correlation Chart
The statistical analysis conducted on geographies consisting of 167,622,815 people shows a moderate negative correlation between the proportion of Immigrants from Bulgaria and unemployment rate among population between the ages 55 and 59 in the United States with a correlation coefficient (R) of -0.492 and weighted average of 4.5%. Similarly, the statistical analysis conducted on geographies consisting of 424,209,965 people shows a moderate negative correlation between the proportion of Burmese and unemployment rate among population between the ages 55 and 59 in the United States with a correlation coefficient (R) of -0.467 and weighted average of 4.5%, a difference of 1.3%.
Unemployment Among Ages 55 to 59 years Correlation Summary
| Measurement | Immigrants from Bulgaria | Burmese |
| Minimum | 2.2% | 0.40% |
| Maximum | 6.3% | 8.6% |
| Range | 4.1% | 8.2% |
| Mean | 3.9% | 4.0% |
| Median | 4.2% | 4.3% |
| Interquartile 25% (IQ1) | 2.8% | 3.3% |
| Interquartile 75% (IQ3) | 4.5% | 4.7% |
| Interquartile Range (IQR) | 1.7% | 1.5% |
| Standard Deviation (Sample) | 1.2% | 1.6% |
| Standard Deviation (Population) | 1.1% | 1.6% |
Demographics Similar to Immigrants from Bulgaria and Burmese by Unemployment Among Ages 55 to 59 years
In terms of unemployment among ages 55 to 59 years, the demographic groups most similar to Immigrants from Bulgaria are Ethiopian (4.5%, a difference of 0.0%), Cypriot (4.5%, a difference of 0.090%), Assyrian/Chaldean/Syriac (4.5%, a difference of 0.18%), English (4.5%, a difference of 0.44%), and Swiss (4.5%, a difference of 0.69%). Similarly, the demographic groups most similar to Burmese are Immigrants from Middle Africa (4.5%, a difference of 0.0%), Scottish (4.5%, a difference of 0.010%), Immigrants from Nepal (4.5%, a difference of 0.090%), Maltese (4.5%, a difference of 0.12%), and Immigrants from Pakistan (4.5%, a difference of 0.15%).
| Demographics | Rating | Rank | Unemployment Among Ages 55 to 59 years |
| Cypriots | 99.9 /100 | #35 | Exceptional 4.5% |
| Ethiopians | 99.9 /100 | #36 | Exceptional 4.5% |
| Immigrants | Bulgaria | 99.9 /100 | #37 | Exceptional 4.5% |
| Assyrians/Chaldeans/Syriacs | 99.9 /100 | #38 | Exceptional 4.5% |
| English | 99.9 /100 | #39 | Exceptional 4.5% |
| Swiss | 99.8 /100 | #40 | Exceptional 4.5% |
| Luxembourgers | 99.8 /100 | #41 | Exceptional 4.5% |
| Immigrants | Kuwait | 99.8 /100 | #42 | Exceptional 4.5% |
| Immigrants | Korea | 99.8 /100 | #43 | Exceptional 4.5% |
| Europeans | 99.8 /100 | #44 | Exceptional 4.5% |
| British | 99.8 /100 | #45 | Exceptional 4.5% |
| Immigrants | Zaire | 99.8 /100 | #46 | Exceptional 4.5% |
| German Russians | 99.8 /100 | #47 | Exceptional 4.5% |
| Immigrants | Moldova | 99.7 /100 | #48 | Exceptional 4.5% |
| Immigrants | Saudi Arabia | 99.7 /100 | #49 | Exceptional 4.5% |
| Immigrants | Pakistan | 99.7 /100 | #50 | Exceptional 4.5% |
| Maltese | 99.7 /100 | #51 | Exceptional 4.5% |
| Scottish | 99.7 /100 | #52 | Exceptional 4.5% |
| Immigrants | Middle Africa | 99.7 /100 | #53 | Exceptional 4.5% |
| Burmese | 99.7 /100 | #54 | Exceptional 4.5% |
| Immigrants | Nepal | 99.6 /100 | #55 | Exceptional 4.5% |