Immigrants from Bolivia vs Sudanese Male Unemployment
COMPARE
Immigrants from Bolivia
Sudanese
Male Unemployment
Male Unemployment Comparison
Immigrants from Bolivia
Sudanese
4.7%
MALE UNEMPLOYMENT
100.0/ 100
METRIC RATING
12th/ 347
METRIC RANK
4.8%
MALE UNEMPLOYMENT
99.8/ 100
METRIC RATING
31st/ 347
METRIC RANK
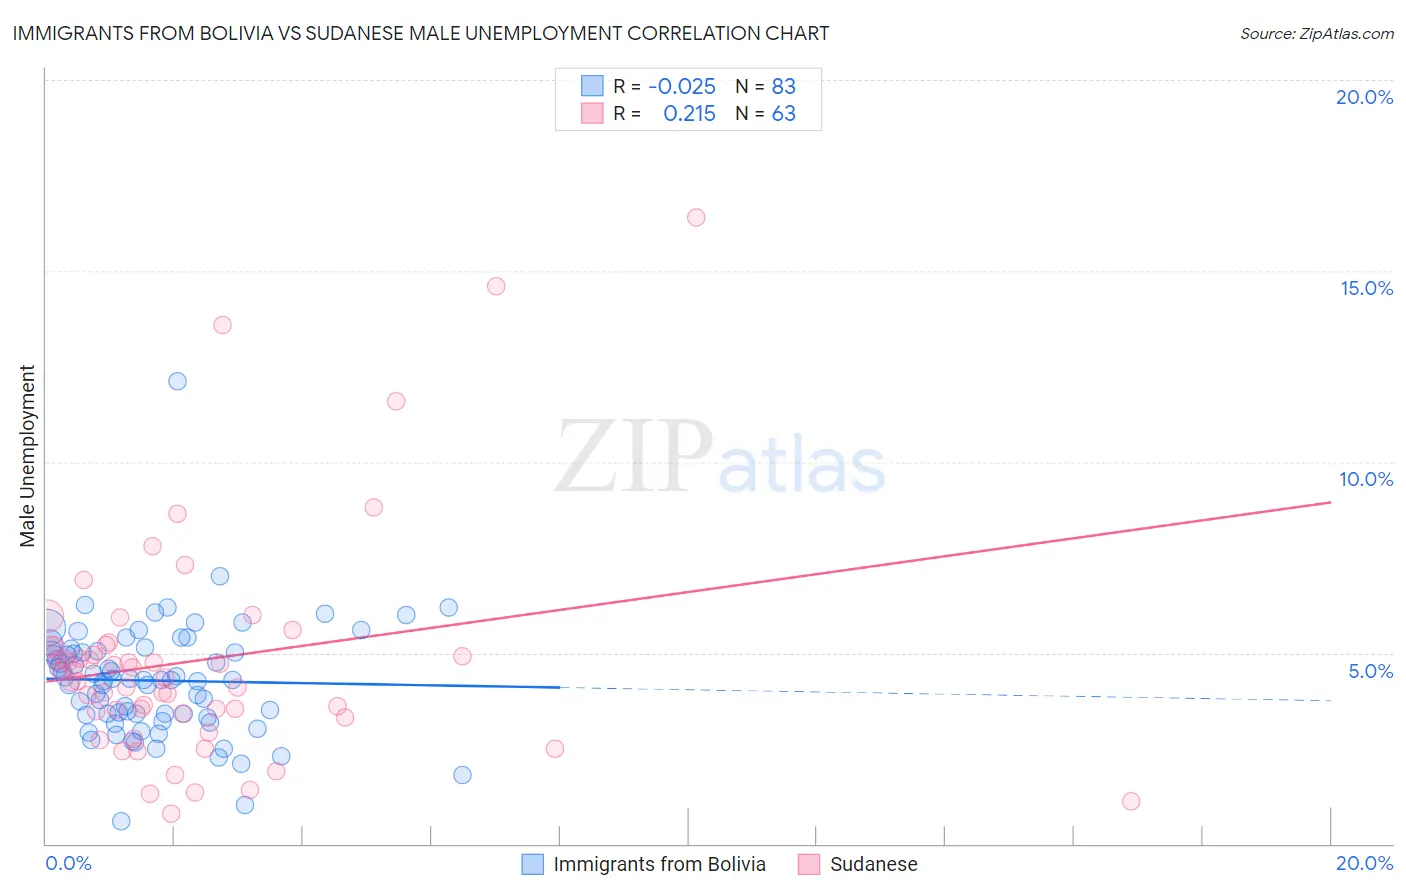
Immigrants from Bolivia vs Sudanese Male Unemployment Correlation Chart
The statistical analysis conducted on geographies consisting of 158,566,605 people shows no correlation between the proportion of Immigrants from Bolivia and unemployment rate among males in the United States with a correlation coefficient (R) of -0.025 and weighted average of 4.7%. Similarly, the statistical analysis conducted on geographies consisting of 110,013,962 people shows a weak positive correlation between the proportion of Sudanese and unemployment rate among males in the United States with a correlation coefficient (R) of 0.215 and weighted average of 4.8%, a difference of 3.6%.
Male Unemployment Correlation Summary
| Measurement | Immigrants from Bolivia | Sudanese |
| Minimum | 0.60% | 0.80% |
| Maximum | 12.1% | 16.4% |
| Range | 11.5% | 15.6% |
| Mean | 4.3% | 4.8% |
| Median | 4.3% | 4.4% |
| Interquartile 25% (IQ1) | 3.4% | 3.4% |
| Interquartile 75% (IQ3) | 5.0% | 5.2% |
| Interquartile Range (IQR) | 1.7% | 1.8% |
| Standard Deviation (Sample) | 1.5% | 3.0% |
| Standard Deviation (Population) | 1.5% | 2.9% |
Demographics Similar to Immigrants from Bolivia and Sudanese by Male Unemployment
In terms of male unemployment, the demographic groups most similar to Immigrants from Bolivia are Bolivian (4.7%, a difference of 0.68%), German (4.7%, a difference of 0.70%), Swedish (4.6%, a difference of 0.73%), Scandinavian (4.7%, a difference of 0.97%), and Swiss (4.7%, a difference of 1.0%). Similarly, the demographic groups most similar to Sudanese are British (4.8%, a difference of 0.25%), Scottish (4.8%, a difference of 0.56%), Bulgarian (4.8%, a difference of 0.69%), Belgian (4.8%, a difference of 0.88%), and Dutch (4.8%, a difference of 1.1%).
| Demographics | Rating | Rank | Male Unemployment |
| Swedes | 100.0 /100 | #11 | Exceptional 4.6% |
| Immigrants | Bolivia | 100.0 /100 | #12 | Exceptional 4.7% |
| Bolivians | 100.0 /100 | #13 | Exceptional 4.7% |
| Germans | 100.0 /100 | #14 | Exceptional 4.7% |
| Scandinavians | 100.0 /100 | #15 | Exceptional 4.7% |
| Swiss | 99.9 /100 | #16 | Exceptional 4.7% |
| Filipinos | 99.9 /100 | #17 | Exceptional 4.7% |
| English | 99.9 /100 | #18 | Exceptional 4.8% |
| Europeans | 99.9 /100 | #19 | Exceptional 4.8% |
| Pennsylvania Germans | 99.9 /100 | #20 | Exceptional 4.8% |
| Immigrants | Taiwan | 99.9 /100 | #21 | Exceptional 4.8% |
| Carpatho Rusyns | 99.9 /100 | #22 | Exceptional 4.8% |
| Tongans | 99.9 /100 | #23 | Exceptional 4.8% |
| Immigrants | South Central Asia | 99.9 /100 | #24 | Exceptional 4.8% |
| Zimbabweans | 99.9 /100 | #25 | Exceptional 4.8% |
| Dutch | 99.9 /100 | #26 | Exceptional 4.8% |
| Belgians | 99.9 /100 | #27 | Exceptional 4.8% |
| Bulgarians | 99.8 /100 | #28 | Exceptional 4.8% |
| Scottish | 99.8 /100 | #29 | Exceptional 4.8% |
| British | 99.8 /100 | #30 | Exceptional 4.8% |
| Sudanese | 99.8 /100 | #31 | Exceptional 4.8% |