Immigrants from Bolivia vs Immigrants from Bosnia and Herzegovina Unemployment Among Ages 25 to 29 years
COMPARE
Immigrants from Bolivia
Immigrants from Bosnia and Herzegovina
Unemployment Among Ages 25 to 29 years
Unemployment Among Ages 25 to 29 years Comparison
Immigrants from Bolivia
Immigrants from Bosnia and Herzegovina
5.9%
UNEMPLOYMENT AMONG AGES 25 TO 29 YEARS
100.0/ 100
METRIC RATING
13th/ 347
METRIC RANK
5.7%
UNEMPLOYMENT AMONG AGES 25 TO 29 YEARS
100.0/ 100
METRIC RATING
8th/ 347
METRIC RANK
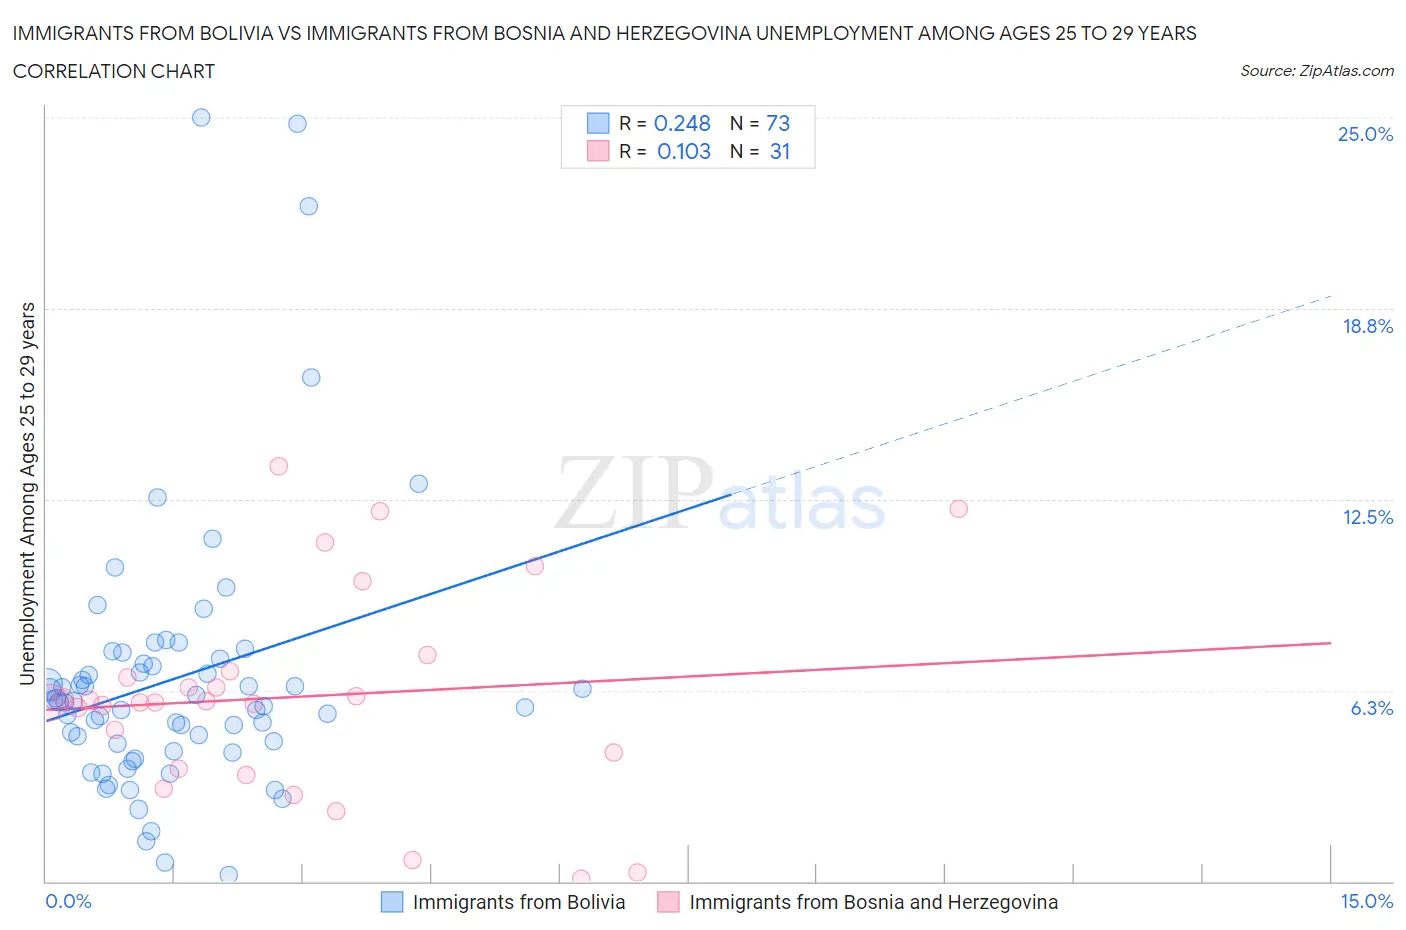
Immigrants from Bolivia vs Immigrants from Bosnia and Herzegovina Unemployment Among Ages 25 to 29 years Correlation Chart
The statistical analysis conducted on geographies consisting of 155,444,296 people shows a weak positive correlation between the proportion of Immigrants from Bolivia and unemployment rate among population between the ages 25 and 29 in the United States with a correlation coefficient (R) of 0.248 and weighted average of 5.9%. Similarly, the statistical analysis conducted on geographies consisting of 153,450,530 people shows a poor positive correlation between the proportion of Immigrants from Bosnia and Herzegovina and unemployment rate among population between the ages 25 and 29 in the United States with a correlation coefficient (R) of 0.103 and weighted average of 5.7%, a difference of 3.2%.
Unemployment Among Ages 25 to 29 years Correlation Summary
| Measurement | Immigrants from Bolivia | Immigrants from Bosnia and Herzegovina |
| Minimum | 0.20% | 0.10% |
| Maximum | 25.0% | 13.6% |
| Range | 24.8% | 13.5% |
| Mean | 6.6% | 6.0% |
| Median | 5.9% | 5.9% |
| Interquartile 25% (IQ1) | 4.4% | 3.7% |
| Interquartile 75% (IQ3) | 7.2% | 6.9% |
| Interquartile Range (IQR) | 2.8% | 3.2% |
| Standard Deviation (Sample) | 4.5% | 3.4% |
| Standard Deviation (Population) | 4.5% | 3.3% |
Demographics Similar to Immigrants from Bolivia and Immigrants from Bosnia and Herzegovina by Unemployment Among Ages 25 to 29 years
In terms of unemployment among ages 25 to 29 years, the demographic groups most similar to Immigrants from Bolivia are Okinawan (5.9%, a difference of 0.030%), Cambodian (5.8%, a difference of 0.15%), Immigrants from Kuwait (5.9%, a difference of 0.63%), Cuban (5.9%, a difference of 0.97%), and Immigrants from Bulgaria (5.9%, a difference of 0.99%). Similarly, the demographic groups most similar to Immigrants from Bosnia and Herzegovina are Immigrants from India (5.7%, a difference of 0.12%), Hmong (5.7%, a difference of 0.20%), Somali (5.6%, a difference of 0.39%), Immigrants from Cuba (5.6%, a difference of 0.45%), and Immigrants from Nepal (5.7%, a difference of 1.3%).
| Demographics | Rating | Rank | Unemployment Among Ages 25 to 29 years |
| Sudanese | 100.0 /100 | #1 | Exceptional 5.4% |
| Tongans | 100.0 /100 | #2 | Exceptional 5.5% |
| Immigrants | Somalia | 100.0 /100 | #3 | Exceptional 5.5% |
| Immigrants | Cuba | 100.0 /100 | #4 | Exceptional 5.6% |
| Somalis | 100.0 /100 | #5 | Exceptional 5.6% |
| Hmong | 100.0 /100 | #6 | Exceptional 5.7% |
| Immigrants | India | 100.0 /100 | #7 | Exceptional 5.7% |
| Immigrants | Bosnia and Herzegovina | 100.0 /100 | #8 | Exceptional 5.7% |
| Immigrants | Nepal | 100.0 /100 | #9 | Exceptional 5.7% |
| Immigrants | Sudan | 100.0 /100 | #10 | Exceptional 5.8% |
| Cambodians | 100.0 /100 | #11 | Exceptional 5.8% |
| Okinawans | 100.0 /100 | #12 | Exceptional 5.9% |
| Immigrants | Bolivia | 100.0 /100 | #13 | Exceptional 5.9% |
| Immigrants | Kuwait | 99.9 /100 | #14 | Exceptional 5.9% |
| Cubans | 99.9 /100 | #15 | Exceptional 5.9% |
| Immigrants | Bulgaria | 99.9 /100 | #16 | Exceptional 5.9% |
| Bolivians | 99.9 /100 | #17 | Exceptional 5.9% |
| Immigrants | Singapore | 99.9 /100 | #18 | Exceptional 5.9% |
| Thais | 99.9 /100 | #19 | Exceptional 5.9% |
| Immigrants | Eritrea | 99.9 /100 | #20 | Exceptional 5.9% |