Immigrants from Belize vs Slavic Unemployment Among Women with Children Under 18 years

COMPARE

Immigrants from Belize
Race
Ancestry
AfghanAfricanAlaska NativeAlaskan AthabascanAlbanianAleutAlsatianAmericanApacheArabArapahoArgentineanArmenianAssyrian/Chaldean/SyriacAustralianAustrianBahamianBangladeshiBarbadianBasqueBelgianBelizeanBermudanBhutaneseBlackfeetBolivianBrazilianBritishBritish West IndianBulgarianBurmeseCajunCambodianCanadianCape VerdeanCarpatho RusynCelticCentral AmericanCentral American IndianCherokeeCheyenneChickasawChileanChineseChippewaChoctawColombianColvilleComancheCosta RicanCreeCreekCroatianCrowCubanCypriotCzechCzechoslovakianDanishDelawareDominicanDutchDutch West IndianEastern EuropeanEcuadorianEgyptianEnglishEstonianEthiopianEuropeanFijianFilipinoFinnishFrenchFrench American IndianFrench CanadianGermanGerman RussianGhanaianGreekGuamanian/ChamorroGuatemalanGuyaneseHaitianHmongHonduranHopiHoumaHungarianIcelanderIndian (Asian)IndonesianInupiatIranianIraqiIrishIroquoisIsraeliItalianJamaicanJapaneseJordanianKenyanKiowaKoreanLaotianLatvianLebaneseLiberianLithuanianLumbeeLuxembourgerMacedonianMalaysianMalteseMarshalleseMenomineeMexicanMexican American IndianMongolianMoroccanNative HawaiianNavajoNepaleseNew ZealanderNicaraguanNigerianNorthern EuropeanNorwegianOkinawanOsageOttawaPaiutePakistaniPalestinianPanamanianParaguayanPennsylvania GermanPeruvianPimaPolishPortuguesePotawatomiPuebloPuerto RicanPuget Sound SalishRomanianRussianSalvadoranSamoanScandinavianScotch-IrishScottishSeminoleSenegaleseSerbianShoshoneSierra LeoneanSiouxSlovakSloveneSomaliSouth AfricanSouth AmericanSouth American IndianSoviet UnionSpaniardSpanishSpanish AmericanSpanish American IndianSri LankanSubsaharan AfricanSudaneseSwedishSwissSyrianTaiwaneseThaiTlingit-HaidaTohono O'OdhamTonganTrinidadian and TobagonianTsimshianTurkishU.S. Virgin IslanderUgandanUkrainianUruguayanUteVenezuelanVietnameseWelshWest IndianYakamaYaquiYugoslavianYumanYup'ikZimbabwean
Immigration
NonimmigrantsImmigrantsAfghanistanAfricaAlbaniaArgentinaArmeniaAsiaAustraliaAustriaBahamasBangladeshBarbadosBelarusBelgiumBelizeBoliviaBosnia and HerzegovinaBrazilBulgariaBurma/MyanmarCabo VerdeCambodiaCameroonCanadaCaribbeanCentral AmericaChileChinaColombiaCongoCosta RicaCroatiaCubaCzechoslovakiaDenmarkDominicaDominican RepublicEastern AfricaEastern AsiaEastern EuropeEcuadorEgyptEl SalvadorEnglandEritreaEthiopiaEuropeFijiFranceGermanyGhanaGreeceGrenadaGuatemalaGuyanaHaitiHondurasHong KongHungaryIndiaIndonesiaIranIraqIrelandIsraelItalyJamaicaJapanJordanKazakhstanKenyaKoreaKuwaitLaosLatin AmericaLatviaLebanonLiberiaLithuaniaMalaysiaMexicoMicronesiaMiddle AfricaMoldovaMoroccoNepalNetherlandsNicaraguaNigeriaNorth AmericaNorth MacedoniaNorthern AfricaNorthern EuropeNorwayOceaniaPakistanPanamaPeruPhilippinesPolandPortugalRomaniaRussiaSaudi ArabiaScotlandSenegalSerbiaSierra LeoneSingaporeSomaliaSouth AfricaSouth AmericaSouth Central AsiaSouth Eastern AsiaSouthern EuropeSpainSri LankaSt. Vincent and the GrenadinesSudanSwedenSwitzerlandSyriaTaiwanThailandTrinidad and TobagoTurkeyUgandaUkraineUruguayUzbekistanVenezuelaVietnamWest IndiesWestern AfricaWestern AsiaWestern EuropeYemenZaireZimbabweAzores
Slavic
Race
Ancestry
AfghanAfricanAlaska NativeAlaskan AthabascanAlbanianAleutAlsatianAmericanApacheArabArapahoArgentineanArmenianAssyrian/Chaldean/SyriacAustralianAustrianBahamianBangladeshiBarbadianBasqueBelgianBelizeanBermudanBhutaneseBlackfeetBolivianBrazilianBritishBritish West IndianBulgarianBurmeseCajunCambodianCanadianCape VerdeanCarpatho RusynCelticCentral AmericanCentral American IndianCherokeeCheyenneChickasawChileanChineseChippewaChoctawColombianColvilleComancheCosta RicanCreeCreekCroatianCrowCubanCypriotCzechCzechoslovakianDanishDelawareDominicanDutchDutch West IndianEastern EuropeanEcuadorianEgyptianEnglishEstonianEthiopianEuropeanFijianFilipinoFinnishFrenchFrench American IndianFrench CanadianGermanGerman RussianGhanaianGreekGuamanian/ChamorroGuatemalanGuyaneseHaitianHmongHonduranHopiHoumaHungarianIcelanderIndian (Asian)IndonesianInupiatIranianIraqiIrishIroquoisIsraeliItalianJamaicanJapaneseJordanianKenyanKiowaKoreanLaotianLatvianLebaneseLiberianLithuanianLumbeeLuxembourgerMacedonianMalaysianMalteseMarshalleseMenomineeMexicanMexican American IndianMongolianMoroccanNative HawaiianNavajoNepaleseNew ZealanderNicaraguanNigerianNorthern EuropeanNorwegianOkinawanOsageOttawaPaiutePakistaniPalestinianPanamanianParaguayanPennsylvania GermanPeruvianPimaPolishPortuguesePotawatomiPuebloPuerto RicanPuget Sound SalishRomanianRussianSalvadoranSamoanScandinavianScotch-IrishScottishSeminoleSenegaleseSerbianShoshoneSierra LeoneanSiouxSlavicSlovakSloveneSomaliSouth AfricanSouth AmericanSouth American IndianSoviet UnionSpaniardSpanishSpanish AmericanSpanish American IndianSri LankanSubsaharan AfricanSudaneseSwedishSwissSyrianTaiwaneseThaiTlingit-HaidaTohono O'OdhamTonganTrinidadian and TobagonianTsimshianTurkishU.S. Virgin IslanderUgandanUkrainianUruguayanUteVenezuelanVietnameseWelshWest IndianYakamaYaquiYugoslavianYumanYup'ikZimbabwean
Immigration
NonimmigrantsImmigrantsAfghanistanAfricaAlbaniaArgentinaArmeniaAsiaAustraliaAustriaBahamasBangladeshBarbadosBelarusBelgiumBoliviaBosnia and HerzegovinaBrazilBulgariaBurma/MyanmarCabo VerdeCambodiaCameroonCanadaCaribbeanCentral AmericaChileChinaColombiaCongoCosta RicaCroatiaCubaCzechoslovakiaDenmarkDominicaDominican RepublicEastern AfricaEastern AsiaEastern EuropeEcuadorEgyptEl SalvadorEnglandEritreaEthiopiaEuropeFijiFranceGermanyGhanaGreeceGrenadaGuatemalaGuyanaHaitiHondurasHong KongHungaryIndiaIndonesiaIranIraqIrelandIsraelItalyJamaicaJapanJordanKazakhstanKenyaKoreaKuwaitLaosLatin AmericaLatviaLebanonLiberiaLithuaniaMalaysiaMexicoMicronesiaMiddle AfricaMoldovaMoroccoNepalNetherlandsNicaraguaNigeriaNorth AmericaNorth MacedoniaNorthern AfricaNorthern EuropeNorwayOceaniaPakistanPanamaPeruPhilippinesPolandPortugalRomaniaRussiaSaudi ArabiaScotlandSenegalSerbiaSierra LeoneSingaporeSomaliaSouth AfricaSouth AmericaSouth Central AsiaSouth Eastern AsiaSouthern EuropeSpainSri LankaSt. Vincent and the GrenadinesSudanSwedenSwitzerlandSyriaTaiwanThailandTrinidad and TobagoTurkeyUgandaUkraineUruguayUzbekistanVenezuelaVietnamWest IndiesWestern AfricaWestern AsiaWestern EuropeYemenZaireZimbabweAzores
Unemployment Among Women with Children Under 18 years
Income
Poverty
Unemployment
Labor Participation
Family Structure
Vehicle Availability
Education Level
Disability

Unemployment Among Women with Children Under 18 years Comparison

Immigrants from Belize

Slavs

Tragic
Excellent
6.7%
UNEMPLOYMENT AMONG WOMEN WITH CHILDREN UNDER 18 YEARS
0.0/ 100
METRIC RATING
320th/ 347
METRIC RANK
5.2%
UNEMPLOYMENT AMONG WOMEN WITH CHILDREN UNDER 18 YEARS
89.8/ 100
METRIC RATING
107th/ 347
METRIC RANK

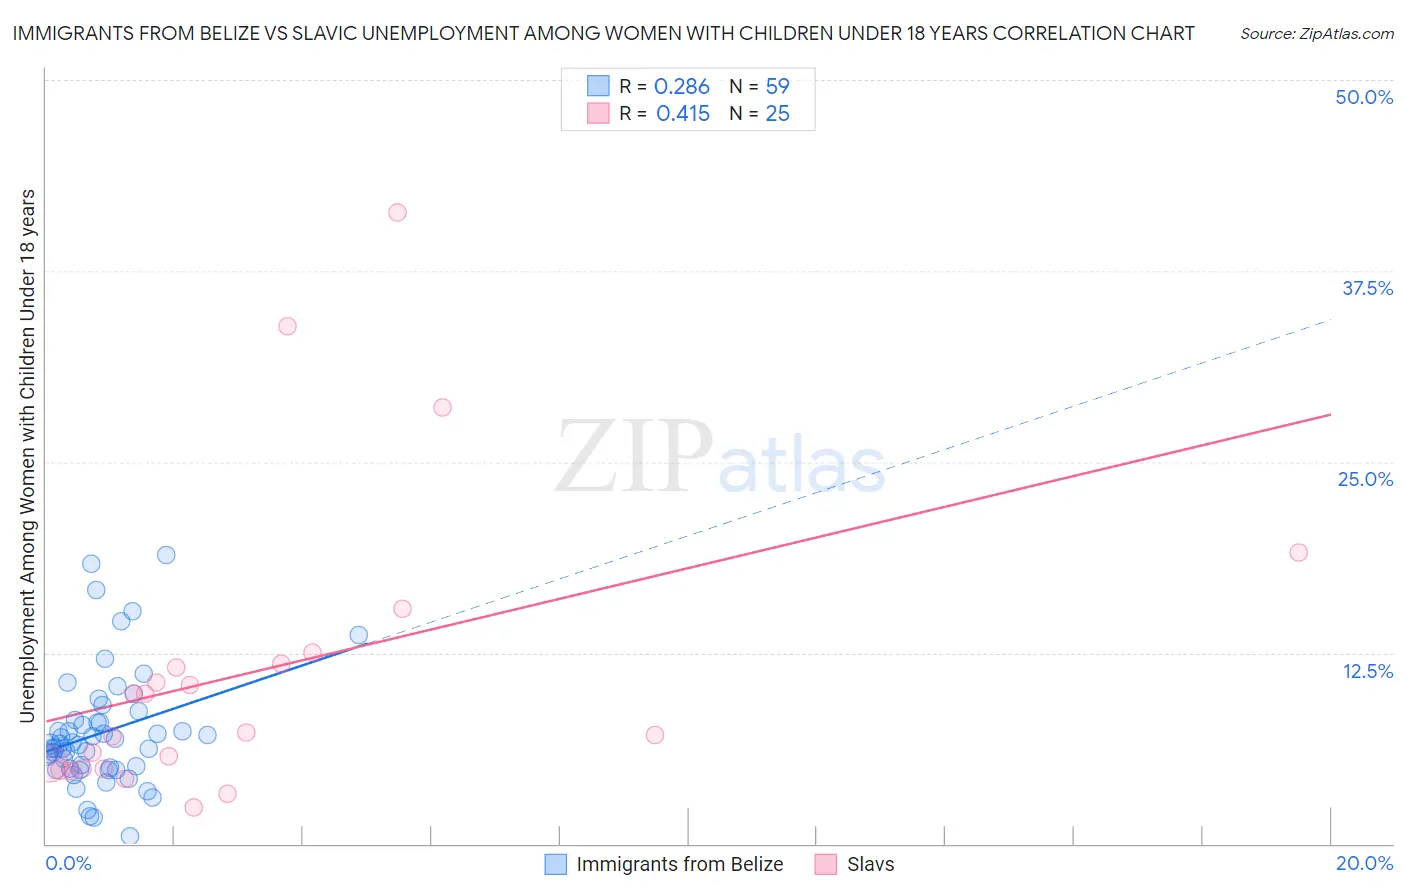
Immigrants from Belize vs Slavic Unemployment Among Women with Children Under 18 years Correlation Chart

The statistical analysis conducted on geographies consisting of 128,888,492 people shows a weak positive correlation between the proportion of Immigrants from Belize and unemployment rate among women with children under the age of 18 in the United States with a correlation coefficient (R) of 0.286 and weighted average of 6.7%. Similarly, the statistical analysis conducted on geographies consisting of 260,877,455 people shows a moderate positive correlation between the proportion of Slavs and unemployment rate among women with children under the age of 18 in the United States with a correlation coefficient (R) of 0.415 and weighted average of 5.2%, a difference of 27.6%.
Immigrants from Belize vs Slavic Unemployment Among Women with Children Under 18 years

Unemployment Among Women with Children Under 18 years Correlation Summary

MeasurementImmigrants from BelizeSlavic
Minimum0.50%2.4%
Maximum18.9%41.3%
Range18.4%38.9%
Mean7.3%11.3%
Median6.5%7.3%
Interquartile 25% (IQ1)4.9%4.9%
Interquartile 75% (IQ3)8.1%12.1%
Interquartile Range (IQR)3.2%7.2%
Standard Deviation (Sample)3.8%9.8%
Standard Deviation (Population)3.8%9.6%

Similar Demographics by Unemployment Among Women with Children Under 18 years

Demographics Similar to Immigrants from Belize by Unemployment Among Women with Children Under 18 years

In terms of unemployment among women with children under 18 years, the demographic groups most similar to Immigrants from Belize are U.S. Virgin Islander (6.7%, a difference of 0.050%), Central American Indian (6.7%, a difference of 0.090%), Alaska Native (6.7%, a difference of 0.33%), Shoshone (6.6%, a difference of 0.62%), and Immigrants from Ecuador (6.6%, a difference of 0.66%).
DemographicsRating | RankUnemployment Among Women with Children Under 18 years
Hispanics or Latinos
0.0
/100
|
#313
Tragic
6.6%
British West Indians
0.0
/100
|
#314
Tragic
6.6%
Immigrants | West Indies
0.0
/100
|
#315
Tragic
6.6%
Immigrants | Ecuador
0.0
/100
|
#316
Tragic
6.6%
Shoshone
0.0
/100
|
#317
Tragic
6.6%
Alaska Natives
0.0
/100
|
#318
Tragic
6.7%
Central American Indians
0.0
/100
|
#319
Tragic
6.7%
Immigrants | Belize
0.0
/100
|
#320
Tragic
6.7%
U.S. Virgin Islanders
0.0
/100
|
#321
Tragic
6.7%
Houma
0.0
/100
|
#322
Tragic
6.8%
Pueblo
0.0
/100
|
#323
Tragic
6.8%
Paiute
0.0
/100
|
#324
Tragic
6.9%
Immigrants | Dominica
0.0
/100
|
#325
Tragic
7.0%
Chippewa
0.0
/100
|
#326
Tragic
7.0%
Lumbee
0.0
/100
|
#327
Tragic
7.1%

Demographics Similar to Slavs by Unemployment Among Women with Children Under 18 years

In terms of unemployment among women with children under 18 years, the demographic groups most similar to Slavs are Pakistani (5.2%, a difference of 0.010%), Immigrants from France (5.2%, a difference of 0.030%), Iranian (5.2%, a difference of 0.040%), Immigrants from Switzerland (5.2%, a difference of 0.050%), and Sri Lankan (5.2%, a difference of 0.090%).
DemographicsRating | RankUnemployment Among Women with Children Under 18 years
Immigrants | Greece
91.4
/100
|
#100
Exceptional
5.2%
Immigrants | Netherlands
91.0
/100
|
#101
Exceptional
5.2%
Immigrants | Cuba
90.9
/100
|
#102
Exceptional
5.2%
Sri Lankans
90.3
/100
|
#103
Exceptional
5.2%
Immigrants | Switzerland
90.1
/100
|
#104
Exceptional
5.2%
Immigrants | France
90.0
/100
|
#105
Excellent
5.2%
Pakistanis
89.9
/100
|
#106
Excellent
5.2%
Slavs
89.8
/100
|
#107
Excellent
5.2%
Iranians
89.7
/100
|
#108
Excellent
5.2%
Immigrants | Russia
89.0
/100
|
#109
Excellent
5.2%
Immigrants | Czechoslovakia
88.9
/100
|
#110
Excellent
5.2%
French Canadians
88.9
/100
|
#111
Excellent
5.2%
Immigrants | Eastern Europe
88.5
/100
|
#112
Excellent
5.2%
French
88.4
/100
|
#113
Excellent
5.2%
Kenyans
88.2
/100
|
#114
Excellent
5.3%