Immigrants from Belize vs Immigrants from Russia Unemployment Among Ages 60 to 64 years

COMPARE

Immigrants from Belize
Race
Ancestry
AfghanAfricanAlaska NativeAlaskan AthabascanAlbanianAleutAlsatianAmericanApacheArabArapahoArgentineanArmenianAssyrian/Chaldean/SyriacAustralianAustrianBahamianBangladeshiBarbadianBasqueBelgianBelizeanBermudanBhutaneseBlackfeetBolivianBrazilianBritishBritish West IndianBulgarianBurmeseCajunCambodianCanadianCape VerdeanCarpatho RusynCelticCentral AmericanCentral American IndianCherokeeCheyenneChickasawChileanChineseChippewaChoctawColombianColvilleComancheCosta RicanCreeCreekCroatianCrowCubanCypriotCzechCzechoslovakianDanishDelawareDominicanDutchDutch West IndianEastern EuropeanEcuadorianEgyptianEnglishEstonianEthiopianEuropeanFijianFilipinoFinnishFrenchFrench American IndianFrench CanadianGermanGerman RussianGhanaianGreekGuamanian/ChamorroGuatemalanGuyaneseHaitianHmongHonduranHopiHoumaHungarianIcelanderIndian (Asian)IndonesianInupiatIranianIraqiIrishIroquoisIsraeliItalianJamaicanJapaneseJordanianKenyanKiowaKoreanLaotianLatvianLebaneseLiberianLithuanianLumbeeLuxembourgerMacedonianMalaysianMalteseMarshalleseMenomineeMexicanMexican American IndianMongolianMoroccanNative HawaiianNavajoNepaleseNew ZealanderNicaraguanNigerianNorthern EuropeanNorwegianOkinawanOsageOttawaPaiutePakistaniPalestinianPanamanianParaguayanPennsylvania GermanPeruvianPimaPolishPortuguesePotawatomiPuebloPuerto RicanPuget Sound SalishRomanianRussianSalvadoranSamoanScandinavianScotch-IrishScottishSeminoleSenegaleseSerbianShoshoneSierra LeoneanSiouxSlavicSlovakSloveneSomaliSouth AfricanSouth AmericanSouth American IndianSoviet UnionSpaniardSpanishSpanish AmericanSpanish American IndianSri LankanSubsaharan AfricanSudaneseSwedishSwissSyrianTaiwaneseThaiTlingit-HaidaTohono O'OdhamTonganTrinidadian and TobagonianTsimshianTurkishU.S. Virgin IslanderUgandanUkrainianUruguayanUteVenezuelanVietnameseWelshWest IndianYakamaYaquiYugoslavianYumanYup'ikZimbabwean
Immigration
NonimmigrantsImmigrantsAfghanistanAfricaAlbaniaArgentinaArmeniaAsiaAustraliaAustriaBahamasBangladeshBarbadosBelarusBelgiumBelizeBoliviaBosnia and HerzegovinaBrazilBulgariaBurma/MyanmarCabo VerdeCambodiaCameroonCanadaCaribbeanCentral AmericaChileChinaColombiaCongoCosta RicaCroatiaCubaCzechoslovakiaDenmarkDominicaDominican RepublicEastern AfricaEastern AsiaEastern EuropeEcuadorEgyptEl SalvadorEnglandEritreaEthiopiaEuropeFijiFranceGermanyGhanaGreeceGrenadaGuatemalaGuyanaHaitiHondurasHong KongHungaryIndiaIndonesiaIranIraqIrelandIsraelItalyJamaicaJapanJordanKazakhstanKenyaKoreaKuwaitLaosLatin AmericaLatviaLebanonLiberiaLithuaniaMalaysiaMexicoMicronesiaMiddle AfricaMoldovaMoroccoNepalNetherlandsNicaraguaNigeriaNorth AmericaNorth MacedoniaNorthern AfricaNorthern EuropeNorwayOceaniaPakistanPanamaPeruPhilippinesPolandPortugalRomaniaSaudi ArabiaScotlandSenegalSerbiaSierra LeoneSingaporeSomaliaSouth AfricaSouth AmericaSouth Central AsiaSouth Eastern AsiaSouthern EuropeSpainSri LankaSt. Vincent and the GrenadinesSudanSwedenSwitzerlandSyriaTaiwanThailandTrinidad and TobagoTurkeyUgandaUkraineUruguayUzbekistanVenezuelaVietnamWest IndiesWestern AfricaWestern AsiaWestern EuropeYemenZaireZimbabweAzores
Immigrants from Russia
Race
Ancestry
AfghanAfricanAlaska NativeAlaskan AthabascanAlbanianAleutAlsatianAmericanApacheArabArapahoArgentineanArmenianAssyrian/Chaldean/SyriacAustralianAustrianBahamianBangladeshiBarbadianBasqueBelgianBelizeanBermudanBhutaneseBlackfeetBolivianBrazilianBritishBritish West IndianBulgarianBurmeseCajunCambodianCanadianCape VerdeanCarpatho RusynCelticCentral AmericanCentral American IndianCherokeeCheyenneChickasawChileanChineseChippewaChoctawColombianColvilleComancheCosta RicanCreeCreekCroatianCrowCubanCypriotCzechCzechoslovakianDanishDelawareDominicanDutchDutch West IndianEastern EuropeanEcuadorianEgyptianEnglishEstonianEthiopianEuropeanFijianFilipinoFinnishFrenchFrench American IndianFrench CanadianGermanGerman RussianGhanaianGreekGuamanian/ChamorroGuatemalanGuyaneseHaitianHmongHonduranHopiHoumaHungarianIcelanderIndian (Asian)IndonesianInupiatIranianIraqiIrishIroquoisIsraeliItalianJamaicanJapaneseJordanianKenyanKiowaKoreanLaotianLatvianLebaneseLiberianLithuanianLumbeeLuxembourgerMacedonianMalaysianMalteseMarshalleseMenomineeMexicanMexican American IndianMongolianMoroccanNative HawaiianNavajoNepaleseNew ZealanderNicaraguanNigerianNorthern EuropeanNorwegianOkinawanOsageOttawaPaiutePakistaniPalestinianPanamanianParaguayanPennsylvania GermanPeruvianPimaPolishPortuguesePotawatomiPuebloPuerto RicanPuget Sound SalishRomanianRussianSalvadoranSamoanScandinavianScotch-IrishScottishSeminoleSenegaleseSerbianShoshoneSierra LeoneanSiouxSlavicSlovakSloveneSomaliSouth AfricanSouth AmericanSouth American IndianSoviet UnionSpaniardSpanishSpanish AmericanSpanish American IndianSri LankanSubsaharan AfricanSudaneseSwedishSwissSyrianTaiwaneseThaiTlingit-HaidaTohono O'OdhamTonganTrinidadian and TobagonianTsimshianTurkishU.S. Virgin IslanderUgandanUkrainianUruguayanUteVenezuelanVietnameseWelshWest IndianYakamaYaquiYugoslavianYumanYup'ikZimbabwean
Immigration
NonimmigrantsImmigrantsAfghanistanAfricaAlbaniaArgentinaArmeniaAsiaAustraliaAustriaBahamasBangladeshBarbadosBelarusBelgiumBoliviaBosnia and HerzegovinaBrazilBulgariaBurma/MyanmarCabo VerdeCambodiaCameroonCanadaCaribbeanCentral AmericaChileChinaColombiaCongoCosta RicaCroatiaCubaCzechoslovakiaDenmarkDominicaDominican RepublicEastern AfricaEastern AsiaEastern EuropeEcuadorEgyptEl SalvadorEnglandEritreaEthiopiaEuropeFijiFranceGermanyGhanaGreeceGrenadaGuatemalaGuyanaHaitiHondurasHong KongHungaryIndiaIndonesiaIranIraqIrelandIsraelItalyJamaicaJapanJordanKazakhstanKenyaKoreaKuwaitLaosLatin AmericaLatviaLebanonLiberiaLithuaniaMalaysiaMexicoMicronesiaMiddle AfricaMoldovaMoroccoNepalNetherlandsNicaraguaNigeriaNorth AmericaNorth MacedoniaNorthern AfricaNorthern EuropeNorwayOceaniaPakistanPanamaPeruPhilippinesPolandPortugalRomaniaRussiaSaudi ArabiaScotlandSenegalSerbiaSierra LeoneSingaporeSomaliaSouth AfricaSouth AmericaSouth Central AsiaSouth Eastern AsiaSouthern EuropeSpainSri LankaSt. Vincent and the GrenadinesSudanSwedenSwitzerlandSyriaTaiwanThailandTrinidad and TobagoTurkeyUgandaUkraineUruguayUzbekistanVenezuelaVietnamWest IndiesWestern AfricaWestern AsiaWestern EuropeYemenZaireZimbabweAzores
Unemployment Among Ages 60 to 64 years
Income
Poverty
Unemployment
Labor Participation
Family Structure
Vehicle Availability
Education Level
Disability

Unemployment Among Ages 60 to 64 years Comparison

Immigrants from Belize

Immigrants from Russia

Tragic
Poor
5.7%
UNEMPLOYMENT AMONG AGES 60 TO 64 YEARS
0.0/ 100
METRIC RATING
319th/ 347
METRIC RANK
4.9%
UNEMPLOYMENT AMONG AGES 60 TO 64 YEARS
13.7/ 100
METRIC RATING
214th/ 347
METRIC RANK

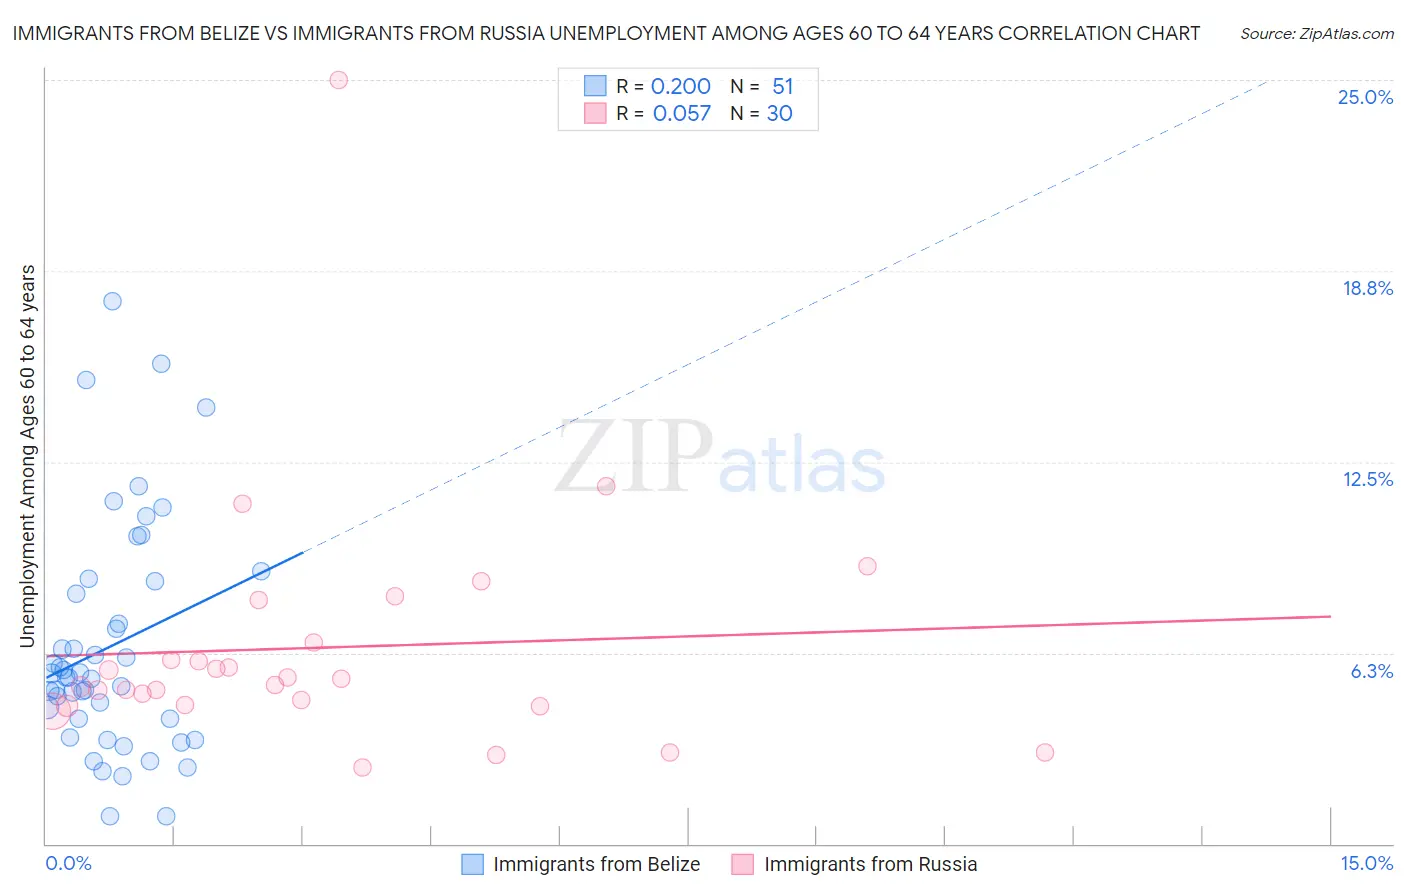
Immigrants from Belize vs Immigrants from Russia Unemployment Among Ages 60 to 64 years Correlation Chart

The statistical analysis conducted on geographies consisting of 126,159,740 people shows a weak positive correlation between the proportion of Immigrants from Belize and unemployment rate among population between the ages 60 and 64 in the United States with a correlation coefficient (R) of 0.200 and weighted average of 5.7%. Similarly, the statistical analysis conducted on geographies consisting of 320,117,534 people shows a slight positive correlation between the proportion of Immigrants from Russia and unemployment rate among population between the ages 60 and 64 in the United States with a correlation coefficient (R) of 0.057 and weighted average of 4.9%, a difference of 15.2%.
Immigrants from Belize vs Immigrants from Russia Unemployment Among Ages 60 to 64 years

Unemployment Among Ages 60 to 64 years Correlation Summary

MeasurementImmigrants from BelizeImmigrants from Russia
Minimum0.90%2.5%
Maximum17.8%25.0%
Range16.9%22.5%
Mean6.5%6.4%
Median5.4%5.3%
Interquartile 25% (IQ1)4.1%4.5%
Interquartile 75% (IQ3)8.6%6.6%
Interquartile Range (IQR)4.5%2.1%
Standard Deviation (Sample)3.8%4.1%
Standard Deviation (Population)3.7%4.1%

Similar Demographics by Unemployment Among Ages 60 to 64 years

Demographics Similar to Immigrants from Belize by Unemployment Among Ages 60 to 64 years

In terms of unemployment among ages 60 to 64 years, the demographic groups most similar to Immigrants from Belize are Native/Alaskan (5.7%, a difference of 0.49%), Shoshone (5.7%, a difference of 0.54%), Colville (5.7%, a difference of 0.77%), Dutch West Indian (5.7%, a difference of 0.82%), and Ecuadorian (5.8%, a difference of 1.2%).
DemographicsRating | RankUnemployment Among Ages 60 to 64 years
Immigrants | West Indies
0.0
/100
|
#312
Tragic
5.5%
Belizeans
0.0
/100
|
#313
Tragic
5.5%
Guyanese
0.0
/100
|
#314
Tragic
5.5%
Cree
0.0
/100
|
#315
Tragic
5.6%
Cheyenne
0.0
/100
|
#316
Tragic
5.6%
Shoshone
0.0
/100
|
#317
Tragic
5.7%
Natives/Alaskans
0.0
/100
|
#318
Tragic
5.7%
Immigrants | Belize
0.0
/100
|
#319
Tragic
5.7%
Colville
0.0
/100
|
#320
Tragic
5.7%
Dutch West Indians
0.0
/100
|
#321
Tragic
5.7%
Ecuadorians
0.0
/100
|
#322
Tragic
5.8%
Alsatians
0.0
/100
|
#323
Tragic
5.8%
Immigrants | Ecuador
0.0
/100
|
#324
Tragic
5.8%
Paiute
0.0
/100
|
#325
Tragic
5.8%
Immigrants | St. Vincent and the Grenadines
0.0
/100
|
#326
Tragic
5.9%

Demographics Similar to Immigrants from Russia by Unemployment Among Ages 60 to 64 years

In terms of unemployment among ages 60 to 64 years, the demographic groups most similar to Immigrants from Russia are Eastern European (4.9%, a difference of 0.040%), Immigrants from South Eastern Asia (4.9%, a difference of 0.050%), Moroccan (4.9%, a difference of 0.090%), Cajun (4.9%, a difference of 0.11%), and Korean (4.9%, a difference of 0.12%).
DemographicsRating | RankUnemployment Among Ages 60 to 64 years
Chippewa
17.3
/100
|
#207
Poor
4.9%
German Russians
16.8
/100
|
#208
Poor
4.9%
Sierra Leoneans
16.5
/100
|
#209
Poor
4.9%
Cherokee
16.1
/100
|
#210
Poor
4.9%
Blackfeet
15.7
/100
|
#211
Poor
4.9%
Moroccans
15.0
/100
|
#212
Poor
4.9%
Eastern Europeans
14.3
/100
|
#213
Poor
4.9%
Immigrants | Russia
13.7
/100
|
#214
Poor
4.9%
Immigrants | South Eastern Asia
13.1
/100
|
#215
Poor
4.9%
Cajuns
12.3
/100
|
#216
Poor
4.9%
Koreans
12.2
/100
|
#217
Poor
4.9%
Immigrants | Singapore
12.0
/100
|
#218
Poor
4.9%
Immigrants | Brazil
11.7
/100
|
#219
Poor
4.9%
Ottawa
11.6
/100
|
#220
Poor
4.9%
Ugandans
10.5
/100
|
#221
Poor
4.9%