Immigrants from Belgium vs Immigrants from Zaire Unemployment Among Ages 25 to 29 years

COMPARE

Immigrants from Belgium
Race
Ancestry
AfghanAfricanAlaska NativeAlaskan AthabascanAlbanianAleutAlsatianAmericanApacheArabArapahoArgentineanArmenianAssyrian/Chaldean/SyriacAustralianAustrianBahamianBangladeshiBarbadianBasqueBelgianBelizeanBermudanBhutaneseBlackfeetBolivianBrazilianBritishBritish West IndianBulgarianBurmeseCajunCambodianCanadianCape VerdeanCarpatho RusynCelticCentral AmericanCentral American IndianCherokeeCheyenneChickasawChileanChineseChippewaChoctawColombianColvilleComancheCosta RicanCreeCreekCroatianCrowCubanCypriotCzechCzechoslovakianDanishDelawareDominicanDutchDutch West IndianEastern EuropeanEcuadorianEgyptianEnglishEstonianEthiopianEuropeanFijianFilipinoFinnishFrenchFrench American IndianFrench CanadianGermanGerman RussianGhanaianGreekGuamanian/ChamorroGuatemalanGuyaneseHaitianHmongHonduranHopiHoumaHungarianIcelanderIndian (Asian)IndonesianInupiatIranianIraqiIrishIroquoisIsraeliItalianJamaicanJapaneseJordanianKenyanKiowaKoreanLaotianLatvianLebaneseLiberianLithuanianLumbeeLuxembourgerMacedonianMalaysianMalteseMarshalleseMenomineeMexicanMexican American IndianMongolianMoroccanNative HawaiianNavajoNepaleseNew ZealanderNicaraguanNigerianNorthern EuropeanNorwegianOkinawanOsageOttawaPaiutePakistaniPalestinianPanamanianParaguayanPennsylvania GermanPeruvianPimaPolishPortuguesePotawatomiPuebloPuerto RicanPuget Sound SalishRomanianRussianSalvadoranSamoanScandinavianScotch-IrishScottishSeminoleSenegaleseSerbianShoshoneSierra LeoneanSiouxSlavicSlovakSloveneSomaliSouth AfricanSouth AmericanSouth American IndianSoviet UnionSpaniardSpanishSpanish AmericanSpanish American IndianSri LankanSubsaharan AfricanSudaneseSwedishSwissSyrianTaiwaneseThaiTlingit-HaidaTohono O'OdhamTonganTrinidadian and TobagonianTsimshianTurkishU.S. Virgin IslanderUgandanUkrainianUruguayanUteVenezuelanVietnameseWelshWest IndianYakamaYaquiYugoslavianYumanYup'ikZimbabwean
Immigration
NonimmigrantsImmigrantsAfghanistanAfricaAlbaniaArgentinaArmeniaAsiaAustraliaAustriaBahamasBangladeshBarbadosBelarusBelgiumBelizeBoliviaBosnia and HerzegovinaBrazilBulgariaBurma/MyanmarCabo VerdeCambodiaCameroonCanadaCaribbeanCentral AmericaChileChinaColombiaCongoCosta RicaCroatiaCubaCzechoslovakiaDenmarkDominicaDominican RepublicEastern AfricaEastern AsiaEastern EuropeEcuadorEgyptEl SalvadorEnglandEritreaEthiopiaEuropeFijiFranceGermanyGhanaGreeceGrenadaGuatemalaGuyanaHaitiHondurasHong KongHungaryIndiaIndonesiaIranIraqIrelandIsraelItalyJamaicaJapanJordanKazakhstanKenyaKoreaKuwaitLaosLatin AmericaLatviaLebanonLiberiaLithuaniaMalaysiaMexicoMicronesiaMiddle AfricaMoldovaMoroccoNepalNetherlandsNicaraguaNigeriaNorth AmericaNorth MacedoniaNorthern AfricaNorthern EuropeNorwayOceaniaPakistanPanamaPeruPhilippinesPolandPortugalRomaniaRussiaSaudi ArabiaScotlandSenegalSerbiaSierra LeoneSingaporeSomaliaSouth AfricaSouth AmericaSouth Central AsiaSouth Eastern AsiaSouthern EuropeSpainSri LankaSt. Vincent and the GrenadinesSudanSwedenSwitzerlandSyriaTaiwanThailandTrinidad and TobagoTurkeyUgandaUkraineUruguayUzbekistanVenezuelaVietnamWest IndiesWestern AfricaWestern AsiaWestern EuropeYemenZimbabweAzores
Immigrants from Zaire
Race
Ancestry
AfghanAfricanAlaska NativeAlaskan AthabascanAlbanianAleutAlsatianAmericanApacheArabArapahoArgentineanArmenianAssyrian/Chaldean/SyriacAustralianAustrianBahamianBangladeshiBarbadianBasqueBelgianBelizeanBermudanBhutaneseBlackfeetBolivianBrazilianBritishBritish West IndianBulgarianBurmeseCajunCambodianCanadianCape VerdeanCarpatho RusynCelticCentral AmericanCentral American IndianCherokeeCheyenneChickasawChileanChineseChippewaChoctawColombianColvilleComancheCosta RicanCreeCreekCroatianCrowCubanCypriotCzechCzechoslovakianDanishDelawareDominicanDutchDutch West IndianEastern EuropeanEcuadorianEgyptianEnglishEstonianEthiopianEuropeanFijianFilipinoFinnishFrenchFrench American IndianFrench CanadianGermanGerman RussianGhanaianGreekGuamanian/ChamorroGuatemalanGuyaneseHaitianHmongHonduranHopiHoumaHungarianIcelanderIndian (Asian)IndonesianInupiatIranianIraqiIrishIroquoisIsraeliItalianJamaicanJapaneseJordanianKenyanKiowaKoreanLaotianLatvianLebaneseLiberianLithuanianLumbeeLuxembourgerMacedonianMalaysianMalteseMarshalleseMenomineeMexicanMexican American IndianMongolianMoroccanNative HawaiianNavajoNepaleseNew ZealanderNicaraguanNigerianNorthern EuropeanNorwegianOkinawanOsageOttawaPaiutePakistaniPalestinianPanamanianParaguayanPennsylvania GermanPeruvianPimaPolishPortuguesePotawatomiPuebloPuerto RicanPuget Sound SalishRomanianRussianSalvadoranSamoanScandinavianScotch-IrishScottishSeminoleSenegaleseSerbianShoshoneSierra LeoneanSiouxSlavicSlovakSloveneSomaliSouth AfricanSouth AmericanSouth American IndianSoviet UnionSpaniardSpanishSpanish AmericanSpanish American IndianSri LankanSubsaharan AfricanSudaneseSwedishSwissSyrianTaiwaneseThaiTlingit-HaidaTohono O'OdhamTonganTrinidadian and TobagonianTsimshianTurkishU.S. Virgin IslanderUgandanUkrainianUruguayanUteVenezuelanVietnameseWelshWest IndianYakamaYaquiYugoslavianYumanYup'ikZimbabwean
Immigration
NonimmigrantsImmigrantsAfghanistanAfricaAlbaniaArgentinaArmeniaAsiaAustraliaAustriaBahamasBangladeshBarbadosBelarusBelizeBoliviaBosnia and HerzegovinaBrazilBulgariaBurma/MyanmarCabo VerdeCambodiaCameroonCanadaCaribbeanCentral AmericaChileChinaColombiaCongoCosta RicaCroatiaCubaCzechoslovakiaDenmarkDominicaDominican RepublicEastern AfricaEastern AsiaEastern EuropeEcuadorEgyptEl SalvadorEnglandEritreaEthiopiaEuropeFijiFranceGermanyGhanaGreeceGrenadaGuatemalaGuyanaHaitiHondurasHong KongHungaryIndiaIndonesiaIranIraqIrelandIsraelItalyJamaicaJapanJordanKazakhstanKenyaKoreaKuwaitLaosLatin AmericaLatviaLebanonLiberiaLithuaniaMalaysiaMexicoMicronesiaMiddle AfricaMoldovaMoroccoNepalNetherlandsNicaraguaNigeriaNorth AmericaNorth MacedoniaNorthern AfricaNorthern EuropeNorwayOceaniaPakistanPanamaPeruPhilippinesPolandPortugalRomaniaRussiaSaudi ArabiaScotlandSenegalSerbiaSierra LeoneSingaporeSomaliaSouth AfricaSouth AmericaSouth Central AsiaSouth Eastern AsiaSouthern EuropeSpainSri LankaSt. Vincent and the GrenadinesSudanSwedenSwitzerlandSyriaTaiwanThailandTrinidad and TobagoTurkeyUgandaUkraineUruguayUzbekistanVenezuelaVietnamWest IndiesWestern AfricaWestern AsiaWestern EuropeYemenZaireZimbabweAzores
Unemployment Among Ages 25 to 29 years
Income
Poverty
Unemployment
Labor Participation
Family Structure
Vehicle Availability
Education Level
Disability

Unemployment Among Ages 25 to 29 years Comparison

Immigrants from Belgium

Immigrants from Zaire

Good
Exceptional
6.5%
UNEMPLOYMENT AMONG AGES 25 TO 29 YEARS
73.8/ 100
METRIC RATING
138th/ 347
METRIC RANK
6.0%
UNEMPLOYMENT AMONG AGES 25 TO 29 YEARS
99.7/ 100
METRIC RATING
27th/ 347
METRIC RANK

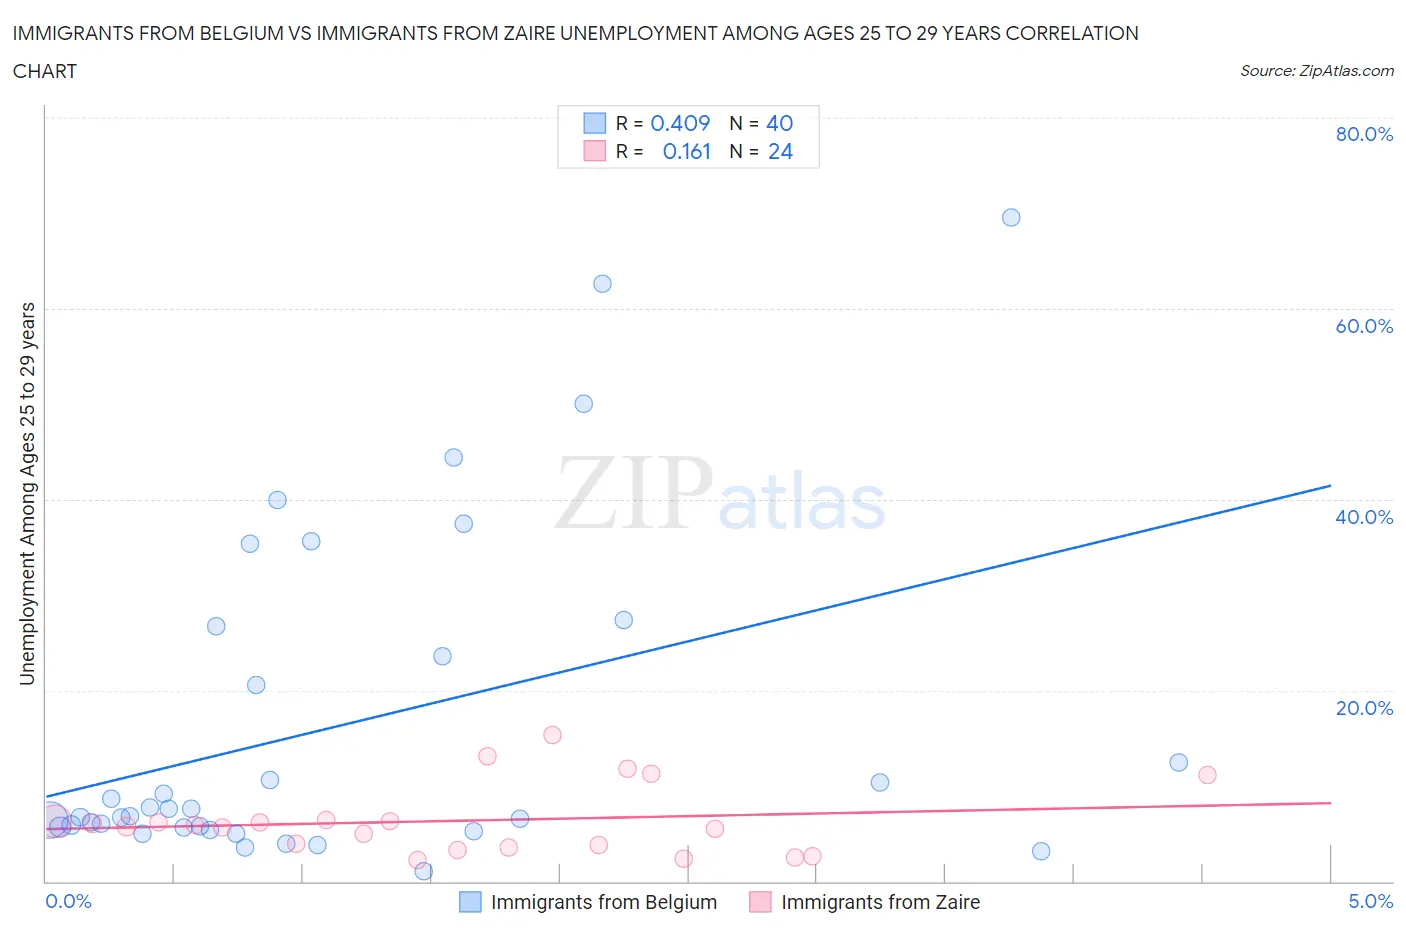
Immigrants from Belgium vs Immigrants from Zaire Unemployment Among Ages 25 to 29 years Correlation Chart

The statistical analysis conducted on geographies consisting of 142,874,204 people shows a moderate positive correlation between the proportion of Immigrants from Belgium and unemployment rate among population between the ages 25 and 29 in the United States with a correlation coefficient (R) of 0.409 and weighted average of 6.5%. Similarly, the statistical analysis conducted on geographies consisting of 105,842,243 people shows a poor positive correlation between the proportion of Immigrants from Zaire and unemployment rate among population between the ages 25 and 29 in the United States with a correlation coefficient (R) of 0.161 and weighted average of 6.0%, a difference of 8.3%.
Immigrants from Belgium vs Immigrants from Zaire Unemployment Among Ages 25 to 29 years

Unemployment Among Ages 25 to 29 years Correlation Summary

MeasurementImmigrants from BelgiumImmigrants from Zaire
Minimum1.1%2.3%
Maximum69.5%15.3%
Range68.4%13.1%
Mean16.3%6.3%
Median7.2%5.8%
Interquartile 25% (IQ1)5.7%3.7%
Interquartile 75% (IQ3)25.1%6.4%
Interquartile Range (IQR)19.4%2.7%
Standard Deviation (Sample)17.4%3.6%
Standard Deviation (Population)17.2%3.5%

Similar Demographics by Unemployment Among Ages 25 to 29 years

Demographics Similar to Immigrants from Belgium by Unemployment Among Ages 25 to 29 years

In terms of unemployment among ages 25 to 29 years, the demographic groups most similar to Immigrants from Belgium are Austrian (6.5%, a difference of 0.0%), Immigrants from Pakistan (6.5%, a difference of 0.0%), Eastern European (6.5%, a difference of 0.020%), Maltese (6.5%, a difference of 0.070%), and Slavic (6.5%, a difference of 0.10%).
DemographicsRating | RankUnemployment Among Ages 25 to 29 years
Immigrants | Afghanistan
79.2
/100
|
#131
Good
6.5%
Poles
76.6
/100
|
#132
Good
6.5%
Immigrants | Europe
75.7
/100
|
#133
Good
6.5%
Immigrants | Vietnam
75.6
/100
|
#134
Good
6.5%
Immigrants | Croatia
75.5
/100
|
#135
Good
6.5%
Northern Europeans
75.4
/100
|
#136
Good
6.5%
Eastern Europeans
74.1
/100
|
#137
Good
6.5%
Immigrants | Belgium
73.8
/100
|
#138
Good
6.5%
Austrians
73.8
/100
|
#139
Good
6.5%
Immigrants | Pakistan
73.8
/100
|
#140
Good
6.5%
Maltese
72.9
/100
|
#141
Good
6.5%
Slavs
72.5
/100
|
#142
Good
6.5%
Lithuanians
72.2
/100
|
#143
Good
6.5%
Immigrants | Micronesia
71.5
/100
|
#144
Good
6.6%
Nicaraguans
70.2
/100
|
#145
Good
6.6%

Demographics Similar to Immigrants from Zaire by Unemployment Among Ages 25 to 29 years

In terms of unemployment among ages 25 to 29 years, the demographic groups most similar to Immigrants from Zaire are Danish (6.0%, a difference of 0.050%), Immigrants from Eastern Africa (6.0%, a difference of 0.12%), New Zealander (6.0%, a difference of 0.20%), Immigrants from South Central Asia (6.1%, a difference of 0.23%), and Bulgarian (6.1%, a difference of 0.34%).
DemographicsRating | RankUnemployment Among Ages 25 to 29 years
Immigrants | Eritrea
99.9
/100
|
#20
Exceptional
5.9%
Immigrants | Ethiopia
99.9
/100
|
#21
Exceptional
6.0%
Immigrants | Japan
99.9
/100
|
#22
Exceptional
6.0%
Immigrants | Venezuela
99.8
/100
|
#23
Exceptional
6.0%
Norwegians
99.8
/100
|
#24
Exceptional
6.0%
New Zealanders
99.8
/100
|
#25
Exceptional
6.0%
Immigrants | Eastern Africa
99.8
/100
|
#26
Exceptional
6.0%
Immigrants | Zaire
99.7
/100
|
#27
Exceptional
6.0%
Danes
99.7
/100
|
#28
Exceptional
6.0%
Immigrants | South Central Asia
99.7
/100
|
#29
Exceptional
6.1%
Bulgarians
99.7
/100
|
#30
Exceptional
6.1%
Filipinos
99.7
/100
|
#31
Exceptional
6.1%
Chinese
99.6
/100
|
#32
Exceptional
6.1%
Yugoslavians
99.6
/100
|
#33
Exceptional
6.1%
Immigrants | Morocco
99.5
/100
|
#34
Exceptional
6.1%