Immigrants from Belgium vs Immigrants from Indonesia Unemployment Among Ages 45 to 54 years
COMPARE
Immigrants from Belgium
Immigrants from Indonesia
Unemployment Among Ages 45 to 54 years
Unemployment Among Ages 45 to 54 years Comparison
Immigrants from Belgium
Immigrants from Indonesia
4.3%
UNEMPLOYMENT AMONG AGES 45 TO 54 YEARS
98.2/ 100
METRIC RATING
74th/ 347
METRIC RANK
4.5%
UNEMPLOYMENT AMONG AGES 45 TO 54 YEARS
60.3/ 100
METRIC RATING
162nd/ 347
METRIC RANK
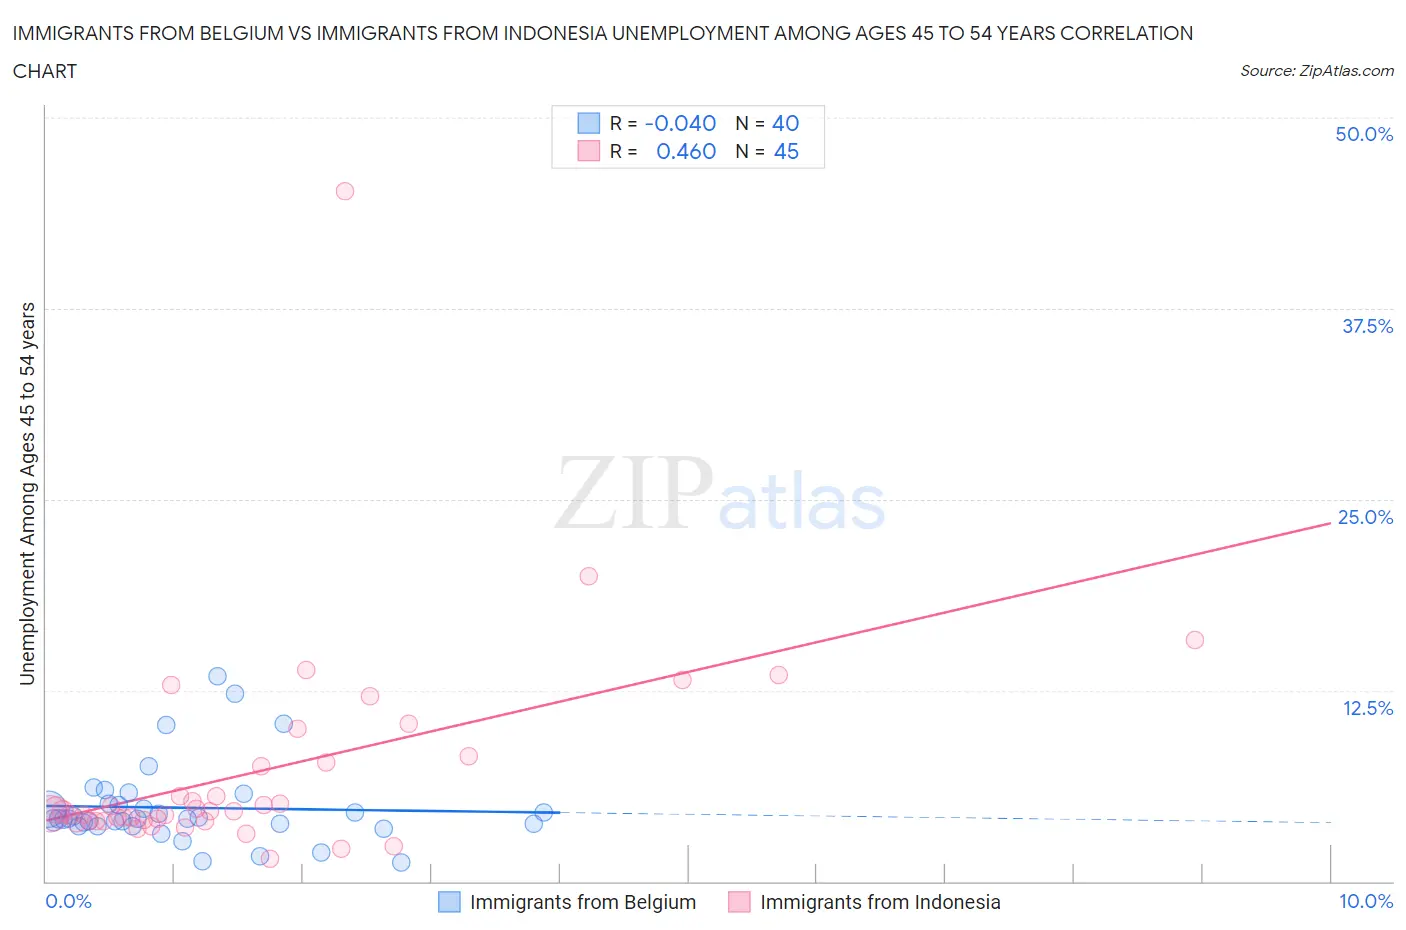
Immigrants from Belgium vs Immigrants from Indonesia Unemployment Among Ages 45 to 54 years Correlation Chart
The statistical analysis conducted on geographies consisting of 145,263,058 people shows no correlation between the proportion of Immigrants from Belgium and unemployment rate among population between the ages 45 and 54 in the United States with a correlation coefficient (R) of -0.040 and weighted average of 4.3%. Similarly, the statistical analysis conducted on geographies consisting of 213,787,944 people shows a moderate positive correlation between the proportion of Immigrants from Indonesia and unemployment rate among population between the ages 45 and 54 in the United States with a correlation coefficient (R) of 0.460 and weighted average of 4.5%, a difference of 4.4%.
Unemployment Among Ages 45 to 54 years Correlation Summary
| Measurement | Immigrants from Belgium | Immigrants from Indonesia |
| Minimum | 1.2% | 1.5% |
| Maximum | 13.4% | 45.2% |
| Range | 12.2% | 43.7% |
| Mean | 4.8% | 7.2% |
| Median | 4.1% | 4.6% |
| Interquartile 25% (IQ1) | 3.7% | 3.9% |
| Interquartile 75% (IQ3) | 5.0% | 8.0% |
| Interquartile Range (IQR) | 1.3% | 4.1% |
| Standard Deviation (Sample) | 2.6% | 7.1% |
| Standard Deviation (Population) | 2.6% | 7.0% |
Similar Demographics by Unemployment Among Ages 45 to 54 years
Demographics Similar to Immigrants from Belgium by Unemployment Among Ages 45 to 54 years
In terms of unemployment among ages 45 to 54 years, the demographic groups most similar to Immigrants from Belgium are Canadian (4.3%, a difference of 0.010%), Kenyan (4.3%, a difference of 0.030%), Slavic (4.3%, a difference of 0.030%), Chilean (4.3%, a difference of 0.090%), and German Russian (4.3%, a difference of 0.18%).
| Demographics | Rating | Rank | Unemployment Among Ages 45 to 54 years |
| Immigrants | Nepal | 98.9 /100 | #67 | Exceptional 4.3% |
| Slovaks | 98.8 /100 | #68 | Exceptional 4.3% |
| Immigrants | Japan | 98.7 /100 | #69 | Exceptional 4.3% |
| Paraguayans | 98.6 /100 | #70 | Exceptional 4.3% |
| Palestinians | 98.5 /100 | #71 | Exceptional 4.3% |
| Whites/Caucasians | 98.4 /100 | #72 | Exceptional 4.3% |
| Canadians | 98.2 /100 | #73 | Exceptional 4.3% |
| Immigrants | Belgium | 98.2 /100 | #74 | Exceptional 4.3% |
| Kenyans | 98.1 /100 | #75 | Exceptional 4.3% |
| Slavs | 98.1 /100 | #76 | Exceptional 4.3% |
| Chileans | 98.1 /100 | #77 | Exceptional 4.3% |
| German Russians | 97.9 /100 | #78 | Exceptional 4.3% |
| Serbians | 97.9 /100 | #79 | Exceptional 4.3% |
| Cambodians | 97.8 /100 | #80 | Exceptional 4.3% |
| Immigrants | Micronesia | 97.6 /100 | #81 | Exceptional 4.3% |
Demographics Similar to Immigrants from Indonesia by Unemployment Among Ages 45 to 54 years
In terms of unemployment among ages 45 to 54 years, the demographic groups most similar to Immigrants from Indonesia are Bangladeshi (4.5%, a difference of 0.030%), Immigrants from Eastern Europe (4.5%, a difference of 0.060%), Immigrants from South Eastern Asia (4.5%, a difference of 0.080%), Samoan (4.5%, a difference of 0.090%), and Nonimmigrants (4.5%, a difference of 0.12%).
| Demographics | Rating | Rank | Unemployment Among Ages 45 to 54 years |
| Marshallese | 70.6 /100 | #155 | Good 4.5% |
| Immigrants | Croatia | 69.6 /100 | #156 | Good 4.5% |
| Indians (Asian) | 68.1 /100 | #157 | Good 4.5% |
| Immigrants | Italy | 65.5 /100 | #158 | Good 4.5% |
| Immigrants | Nonimmigrants | 62.8 /100 | #159 | Good 4.5% |
| Immigrants | South Eastern Asia | 62.0 /100 | #160 | Good 4.5% |
| Immigrants | Eastern Europe | 61.6 /100 | #161 | Good 4.5% |
| Immigrants | Indonesia | 60.3 /100 | #162 | Good 4.5% |
| Bangladeshis | 59.7 /100 | #163 | Average 4.5% |
| Samoans | 58.5 /100 | #164 | Average 4.5% |
| Maltese | 57.9 /100 | #165 | Average 4.5% |
| Immigrants | Western Europe | 57.4 /100 | #166 | Average 4.5% |
| Immigrants | Brazil | 56.4 /100 | #167 | Average 4.5% |
| Immigrants | Europe | 54.7 /100 | #168 | Average 4.5% |
| Immigrants | Egypt | 54.7 /100 | #169 | Average 4.5% |