Immigrants from Austria vs Immigrants from Congo Unemployment Among Seniors over 75 years

COMPARE

Immigrants from Austria
Race
Ancestry
AfghanAfricanAlaska NativeAlaskan AthabascanAlbanianAleutAlsatianAmericanApacheArabArapahoArgentineanArmenianAssyrian/Chaldean/SyriacAustralianAustrianBahamianBangladeshiBarbadianBasqueBelgianBelizeanBermudanBhutaneseBlackfeetBolivianBrazilianBritishBritish West IndianBulgarianBurmeseCajunCambodianCanadianCape VerdeanCarpatho RusynCelticCentral AmericanCentral American IndianCherokeeCheyenneChickasawChileanChineseChippewaChoctawColombianColvilleComancheCosta RicanCreeCreekCroatianCrowCubanCypriotCzechCzechoslovakianDanishDelawareDominicanDutchDutch West IndianEastern EuropeanEcuadorianEgyptianEnglishEstonianEthiopianEuropeanFijianFilipinoFinnishFrenchFrench American IndianFrench CanadianGermanGerman RussianGhanaianGreekGuamanian/ChamorroGuatemalanGuyaneseHaitianHmongHonduranHopiHoumaHungarianIcelanderIndian (Asian)IndonesianInupiatIranianIraqiIrishIroquoisIsraeliItalianJamaicanJapaneseJordanianKenyanKiowaKoreanLaotianLatvianLebaneseLiberianLithuanianLumbeeLuxembourgerMacedonianMalaysianMalteseMarshalleseMexicanMexican American IndianMongolianMoroccanNative HawaiianNavajoNepaleseNew ZealanderNicaraguanNigerianNorthern EuropeanNorwegianOkinawanOsageOttawaPaiutePakistaniPalestinianPanamanianParaguayanPennsylvania GermanPeruvianPimaPolishPortuguesePotawatomiPuebloPuerto RicanPuget Sound SalishRomanianRussianSalvadoranSamoanScandinavianScotch-IrishScottishSeminoleSenegaleseSerbianShoshoneSierra LeoneanSiouxSlavicSlovakSloveneSomaliSouth AfricanSouth AmericanSouth American IndianSoviet UnionSpaniardSpanishSpanish AmericanSpanish American IndianSri LankanSubsaharan AfricanSudaneseSwedishSwissSyrianTaiwaneseThaiTlingit-HaidaTohono O'OdhamTonganTrinidadian and TobagonianTsimshianTurkishU.S. Virgin IslanderUgandanUkrainianUruguayanUteVenezuelanVietnameseWelshWest IndianYakamaYaquiYugoslavianYumanYup'ikZimbabwean
Immigration
NonimmigrantsImmigrantsAfghanistanAfricaAlbaniaArgentinaArmeniaAsiaAustraliaAustriaBahamasBangladeshBarbadosBelarusBelgiumBelizeBoliviaBosnia and HerzegovinaBrazilBulgariaBurma/MyanmarCabo VerdeCambodiaCameroonCanadaCaribbeanCentral AmericaChileChinaColombiaCosta RicaCroatiaCubaCzechoslovakiaDenmarkDominicaDominican RepublicEastern AfricaEastern AsiaEastern EuropeEcuadorEgyptEl SalvadorEnglandEritreaEthiopiaEuropeFijiFranceGermanyGhanaGreeceGrenadaGuatemalaGuyanaHaitiHondurasHong KongHungaryIndiaIndonesiaIranIraqIrelandIsraelItalyJamaicaJapanJordanKazakhstanKenyaKoreaKuwaitLaosLatin AmericaLatviaLebanonLiberiaLithuaniaMalaysiaMexicoMicronesiaMiddle AfricaMoldovaMoroccoNepalNetherlandsNicaraguaNigeriaNorth AmericaNorth MacedoniaNorthern AfricaNorthern EuropeNorwayOceaniaPakistanPanamaPeruPhilippinesPolandPortugalRomaniaRussiaSaudi ArabiaScotlandSenegalSerbiaSierra LeoneSingaporeSomaliaSouth AfricaSouth AmericaSouth Central AsiaSouth Eastern AsiaSouthern EuropeSpainSri LankaSt. Vincent and the GrenadinesSudanSwedenSwitzerlandSyriaTaiwanThailandTrinidad and TobagoTurkeyUgandaUkraineUruguayUzbekistanVenezuelaVietnamWest IndiesWestern AfricaWestern AsiaWestern EuropeYemenZaireZimbabweAzores
Immigrants from Congo
Race
Ancestry
AfghanAfricanAlaska NativeAlaskan AthabascanAlbanianAleutAlsatianAmericanApacheArabArapahoArgentineanArmenianAssyrian/Chaldean/SyriacAustralianAustrianBahamianBangladeshiBarbadianBasqueBelgianBelizeanBermudanBhutaneseBlackfeetBolivianBrazilianBritishBritish West IndianBulgarianBurmeseCajunCambodianCanadianCape VerdeanCarpatho RusynCelticCentral AmericanCentral American IndianCherokeeCheyenneChickasawChileanChineseChippewaChoctawColombianColvilleComancheCosta RicanCreeCreekCroatianCrowCubanCypriotCzechCzechoslovakianDanishDelawareDominicanDutchDutch West IndianEastern EuropeanEcuadorianEgyptianEnglishEstonianEthiopianEuropeanFijianFilipinoFinnishFrenchFrench American IndianFrench CanadianGermanGerman RussianGhanaianGreekGuamanian/ChamorroGuatemalanGuyaneseHaitianHmongHonduranHopiHoumaHungarianIcelanderIndian (Asian)IndonesianInupiatIranianIraqiIrishIroquoisIsraeliItalianJamaicanJapaneseJordanianKenyanKiowaKoreanLaotianLatvianLebaneseLiberianLithuanianLumbeeLuxembourgerMacedonianMalaysianMalteseMarshalleseMexicanMexican American IndianMongolianMoroccanNative HawaiianNavajoNepaleseNew ZealanderNicaraguanNigerianNorthern EuropeanNorwegianOkinawanOsageOttawaPaiutePakistaniPalestinianPanamanianParaguayanPennsylvania GermanPeruvianPimaPolishPortuguesePotawatomiPuebloPuerto RicanPuget Sound SalishRomanianRussianSalvadoranSamoanScandinavianScotch-IrishScottishSeminoleSenegaleseSerbianShoshoneSierra LeoneanSiouxSlavicSlovakSloveneSomaliSouth AfricanSouth AmericanSouth American IndianSoviet UnionSpaniardSpanishSpanish AmericanSpanish American IndianSri LankanSubsaharan AfricanSudaneseSwedishSwissSyrianTaiwaneseThaiTlingit-HaidaTohono O'OdhamTonganTrinidadian and TobagonianTsimshianTurkishU.S. Virgin IslanderUgandanUkrainianUruguayanUteVenezuelanVietnameseWelshWest IndianYakamaYaquiYugoslavianYumanYup'ikZimbabwean
Immigration
NonimmigrantsImmigrantsAfghanistanAfricaAlbaniaArgentinaArmeniaAsiaAustraliaBahamasBangladeshBarbadosBelarusBelgiumBelizeBoliviaBosnia and HerzegovinaBrazilBulgariaBurma/MyanmarCabo VerdeCambodiaCameroonCanadaCaribbeanCentral AmericaChileChinaColombiaCongoCosta RicaCroatiaCubaCzechoslovakiaDenmarkDominicaDominican RepublicEastern AfricaEastern AsiaEastern EuropeEcuadorEgyptEl SalvadorEnglandEritreaEthiopiaEuropeFijiFranceGermanyGhanaGreeceGrenadaGuatemalaGuyanaHaitiHondurasHong KongHungaryIndiaIndonesiaIranIraqIrelandIsraelItalyJamaicaJapanJordanKazakhstanKenyaKoreaKuwaitLaosLatin AmericaLatviaLebanonLiberiaLithuaniaMalaysiaMexicoMicronesiaMiddle AfricaMoldovaMoroccoNepalNetherlandsNicaraguaNigeriaNorth AmericaNorth MacedoniaNorthern AfricaNorthern EuropeNorwayOceaniaPakistanPanamaPeruPhilippinesPolandPortugalRomaniaRussiaSaudi ArabiaScotlandSenegalSerbiaSierra LeoneSingaporeSomaliaSouth AfricaSouth AmericaSouth Central AsiaSouth Eastern AsiaSouthern EuropeSpainSri LankaSt. Vincent and the GrenadinesSudanSwedenSwitzerlandSyriaTaiwanThailandTrinidad and TobagoTurkeyUgandaUkraineUruguayUzbekistanVenezuelaVietnamWest IndiesWestern AfricaWestern AsiaWestern EuropeYemenZaireZimbabweAzores
Unemployment Among Seniors over 75 years
Income
Poverty
Unemployment
Labor Participation
Family Structure
Vehicle Availability
Education Level
Disability

Unemployment Among Seniors over 75 years Comparison

Immigrants from Austria

Immigrants from Congo

Exceptional
Exceptional
8.0%
UNEMPLOYMENT AMONG SENIORS OVER 75 YEARS
99.9/ 100
METRIC RATING
66th/ 347
METRIC RANK
6.7%
UNEMPLOYMENT AMONG SENIORS OVER 75 YEARS
100.0/ 100
METRIC RATING
13th/ 347
METRIC RANK

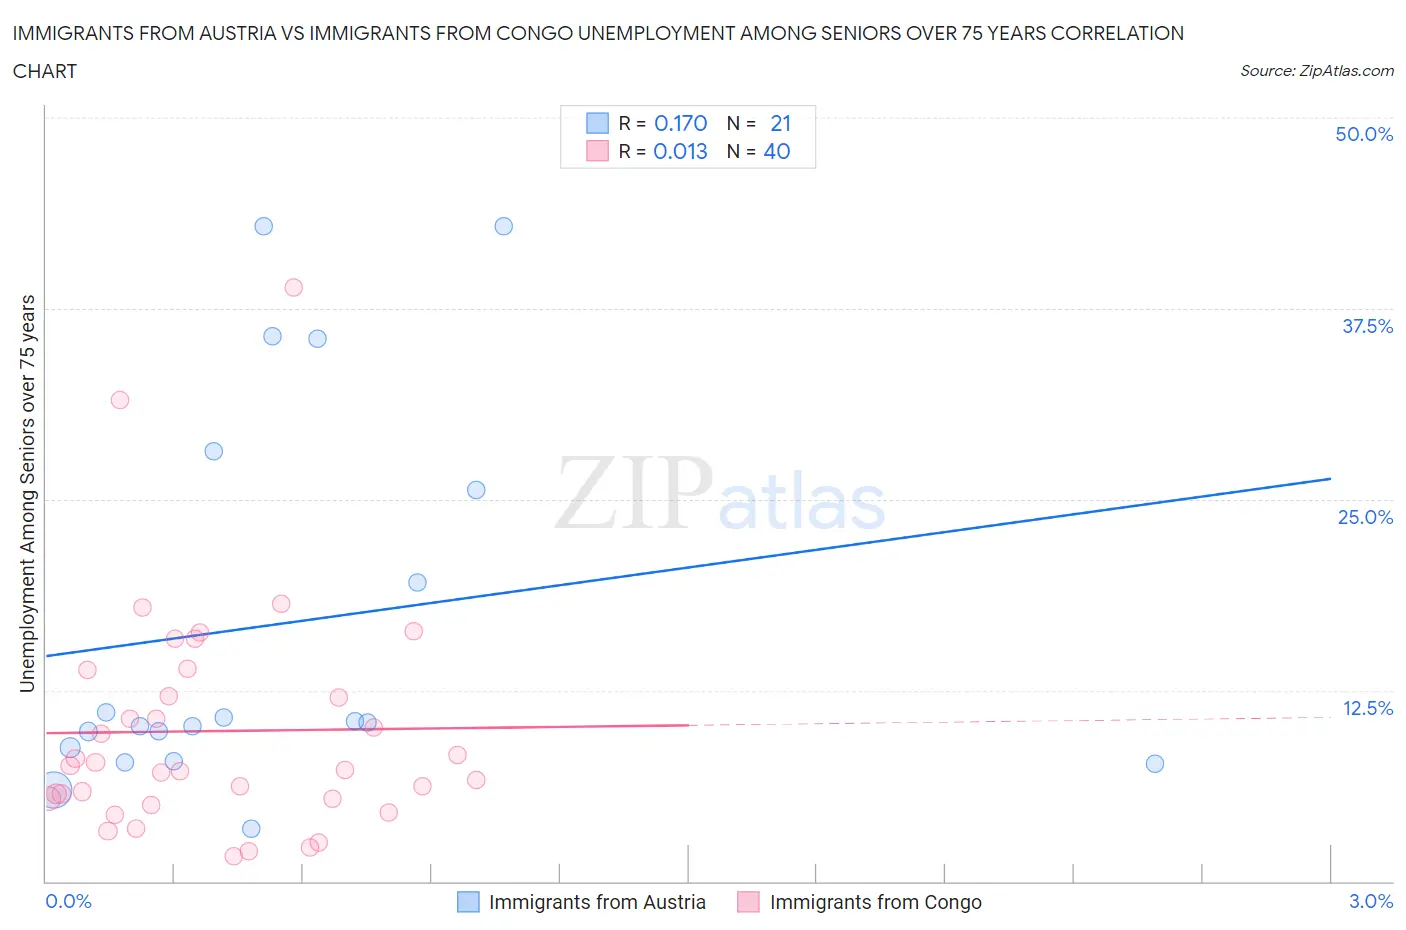
Immigrants from Austria vs Immigrants from Congo Unemployment Among Seniors over 75 years Correlation Chart

The statistical analysis conducted on geographies consisting of 115,770,001 people shows a poor positive correlation between the proportion of Immigrants from Austria and unemployment rate among seniors over the age of 75 in the United States with a correlation coefficient (R) of 0.170 and weighted average of 8.0%. Similarly, the statistical analysis conducted on geographies consisting of 70,470,429 people shows no correlation between the proportion of Immigrants from Congo and unemployment rate among seniors over the age of 75 in the United States with a correlation coefficient (R) of 0.013 and weighted average of 6.7%, a difference of 18.2%.
Immigrants from Austria vs Immigrants from Congo Unemployment Among Seniors over 75 years

Unemployment Among Seniors over 75 years Correlation Summary

MeasurementImmigrants from AustriaImmigrants from Congo
Minimum3.4%1.6%
Maximum42.9%38.9%
Range39.5%37.3%
Mean16.9%9.8%
Median10.4%7.4%
Interquartile 25% (IQ1)8.3%5.4%
Interquartile 75% (IQ3)26.9%13.0%
Interquartile Range (IQR)18.6%7.6%
Standard Deviation (Sample)12.7%7.5%
Standard Deviation (Population)12.4%7.4%

Similar Demographics by Unemployment Among Seniors over 75 years

Demographics Similar to Immigrants from Austria by Unemployment Among Seniors over 75 years

In terms of unemployment among seniors over 75 years, the demographic groups most similar to Immigrants from Austria are Immigrants from Syria (8.0%, a difference of 0.040%), Immigrants from South Africa (8.0%, a difference of 0.13%), Indian (Asian) (8.0%, a difference of 0.14%), Argentinean (7.9%, a difference of 0.19%), and Immigrants from Argentina (8.0%, a difference of 0.22%).
DemographicsRating | RankUnemployment Among Seniors over 75 years
Indonesians
99.9
/100
|
#59
Exceptional
7.9%
Immigrants | Morocco
99.9
/100
|
#60
Exceptional
7.9%
Uruguayans
99.9
/100
|
#61
Exceptional
7.9%
Immigrants | Albania
99.9
/100
|
#62
Exceptional
7.9%
Immigrants | Nicaragua
99.9
/100
|
#63
Exceptional
7.9%
Immigrants | Taiwan
99.9
/100
|
#64
Exceptional
7.9%
Argentineans
99.9
/100
|
#65
Exceptional
7.9%
Immigrants | Austria
99.9
/100
|
#66
Exceptional
8.0%
Immigrants | Syria
99.9
/100
|
#67
Exceptional
8.0%
Immigrants | South Africa
99.9
/100
|
#68
Exceptional
8.0%
Indians (Asian)
99.9
/100
|
#69
Exceptional
8.0%
Immigrants | Argentina
99.9
/100
|
#70
Exceptional
8.0%
Immigrants | Cambodia
99.9
/100
|
#71
Exceptional
8.0%
Bolivians
99.9
/100
|
#72
Exceptional
8.0%
Immigrants | France
99.9
/100
|
#73
Exceptional
8.0%

Demographics Similar to Immigrants from Congo by Unemployment Among Seniors over 75 years

In terms of unemployment among seniors over 75 years, the demographic groups most similar to Immigrants from Congo are Comanche (6.7%, a difference of 0.81%), Immigrants from Grenada (6.7%, a difference of 0.94%), Yuman (6.7%, a difference of 1.0%), Ute (6.8%, a difference of 1.1%), and Soviet Union (6.6%, a difference of 1.3%).
DemographicsRating | RankUnemployment Among Seniors over 75 years
Immigrants | Armenia
100.0
/100
|
#6
Exceptional
6.5%
Spanish American Indians
100.0
/100
|
#7
Exceptional
6.5%
Taiwanese
100.0
/100
|
#8
Exceptional
6.6%
Soviet Union
100.0
/100
|
#9
Exceptional
6.6%
Yuman
100.0
/100
|
#10
Exceptional
6.7%
Immigrants | Grenada
100.0
/100
|
#11
Exceptional
6.7%
Comanche
100.0
/100
|
#12
Exceptional
6.7%
Immigrants | Congo
100.0
/100
|
#13
Exceptional
6.7%
Ute
100.0
/100
|
#14
Exceptional
6.8%
Icelanders
100.0
/100
|
#15
Exceptional
7.0%
Seminole
100.0
/100
|
#16
Exceptional
7.1%
Immigrants | Switzerland
100.0
/100
|
#17
Exceptional
7.2%
Immigrants | Uzbekistan
100.0
/100
|
#18
Exceptional
7.2%
Immigrants | Zaire
100.0
/100
|
#19
Exceptional
7.2%
Armenians
100.0
/100
|
#20
Exceptional
7.2%