Immigrants from Asia vs Immigrants from Mexico Unemployment Among Women with Children Under 18 years
COMPARE
Immigrants from Asia
Immigrants from Mexico
Unemployment Among Women with Children Under 18 years
Unemployment Among Women with Children Under 18 years Comparison
Immigrants from Asia
Immigrants from Mexico
5.1%
UNEMPLOYMENT AMONG WOMEN WITH CHILDREN UNDER 18 YEARS
95.8/ 100
METRIC RATING
75th/ 347
METRIC RANK
6.6%
UNEMPLOYMENT AMONG WOMEN WITH CHILDREN UNDER 18 YEARS
0.0/ 100
METRIC RATING
312th/ 347
METRIC RANK
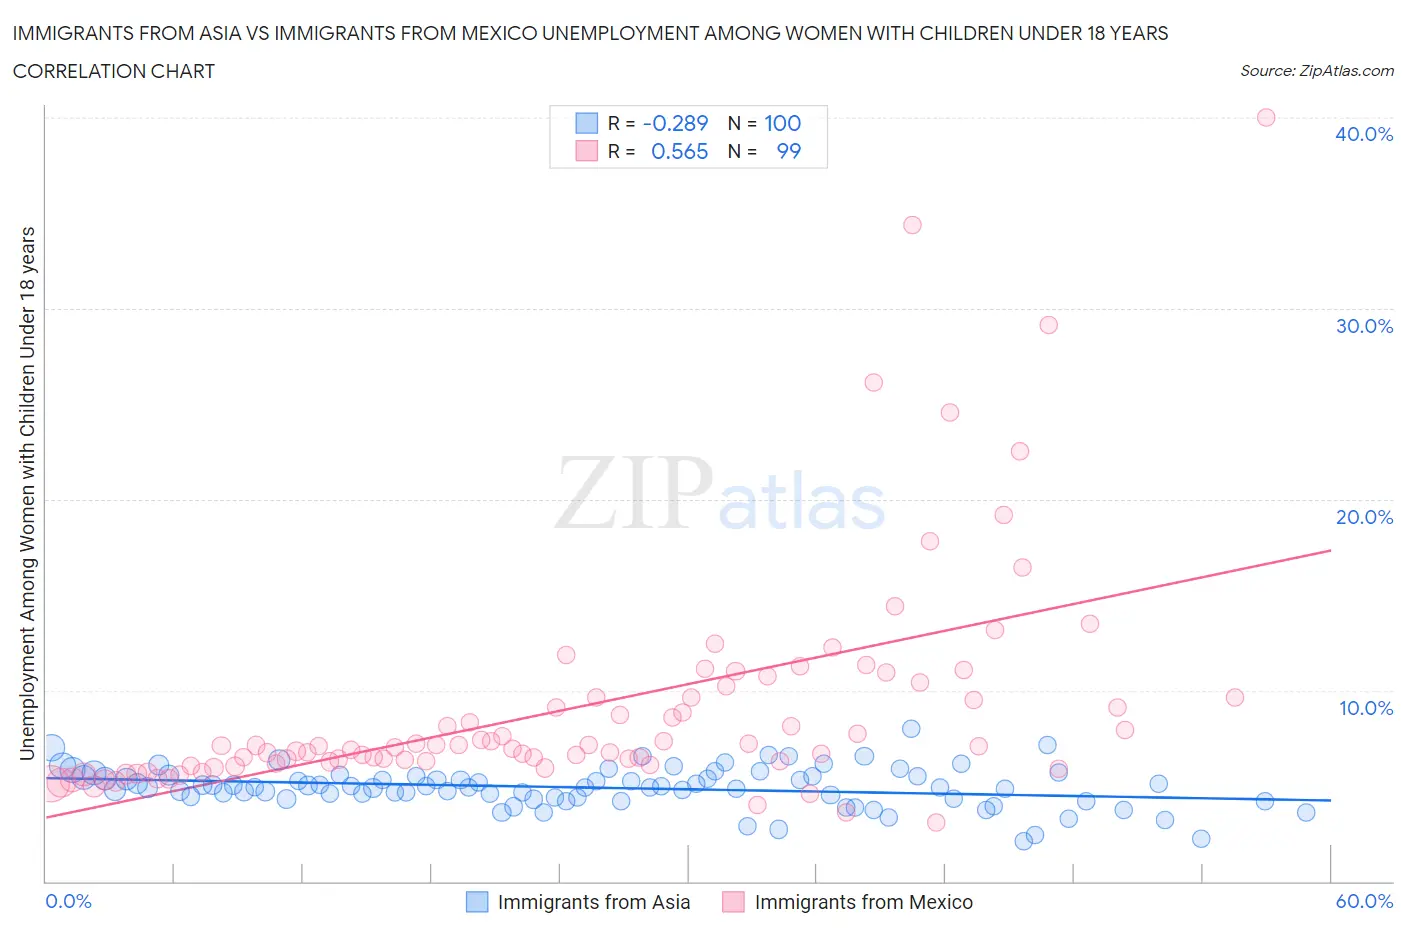
Immigrants from Asia vs Immigrants from Mexico Unemployment Among Women with Children Under 18 years Correlation Chart
The statistical analysis conducted on geographies consisting of 506,016,351 people shows a weak negative correlation between the proportion of Immigrants from Asia and unemployment rate among women with children under the age of 18 in the United States with a correlation coefficient (R) of -0.289 and weighted average of 5.1%. Similarly, the statistical analysis conducted on geographies consisting of 478,971,563 people shows a substantial positive correlation between the proportion of Immigrants from Mexico and unemployment rate among women with children under the age of 18 in the United States with a correlation coefficient (R) of 0.565 and weighted average of 6.6%, a difference of 28.0%.
Unemployment Among Women with Children Under 18 years Correlation Summary
| Measurement | Immigrants from Asia | Immigrants from Mexico |
| Minimum | 2.1% | 3.1% |
| Maximum | 8.0% | 40.0% |
| Range | 5.9% | 36.9% |
| Mean | 4.9% | 9.2% |
| Median | 4.9% | 7.1% |
| Interquartile 25% (IQ1) | 4.4% | 6.2% |
| Interquartile 75% (IQ3) | 5.5% | 9.6% |
| Interquartile Range (IQR) | 1.1% | 3.4% |
| Standard Deviation (Sample) | 1.0% | 6.1% |
| Standard Deviation (Population) | 1.0% | 6.1% |
Similar Demographics by Unemployment Among Women with Children Under 18 years
Demographics Similar to Immigrants from Asia by Unemployment Among Women with Children Under 18 years
In terms of unemployment among women with children under 18 years, the demographic groups most similar to Immigrants from Asia are Immigrants from Northern Europe (5.1%, a difference of 0.030%), Puget Sound Salish (5.1%, a difference of 0.030%), Albanian (5.1%, a difference of 0.040%), Zimbabwean (5.1%, a difference of 0.040%), and Assyrian/Chaldean/Syriac (5.1%, a difference of 0.070%).
| Demographics | Rating | Rank | Unemployment Among Women with Children Under 18 years |
| Irish | 96.8 /100 | #68 | Exceptional 5.1% |
| Austrians | 96.6 /100 | #69 | Exceptional 5.1% |
| Icelanders | 96.6 /100 | #70 | Exceptional 5.1% |
| Serbians | 96.5 /100 | #71 | Exceptional 5.1% |
| Immigrants | Bolivia | 96.1 /100 | #72 | Exceptional 5.1% |
| Albanians | 95.9 /100 | #73 | Exceptional 5.1% |
| Immigrants | Northern Europe | 95.9 /100 | #74 | Exceptional 5.1% |
| Immigrants | Asia | 95.8 /100 | #75 | Exceptional 5.1% |
| Puget Sound Salish | 95.8 /100 | #76 | Exceptional 5.1% |
| Zimbabweans | 95.7 /100 | #77 | Exceptional 5.1% |
| Assyrians/Chaldeans/Syriacs | 95.7 /100 | #78 | Exceptional 5.1% |
| Immigrants | Croatia | 95.6 /100 | #79 | Exceptional 5.1% |
| Bolivians | 95.5 /100 | #80 | Exceptional 5.1% |
| Immigrants | Lithuania | 95.4 /100 | #81 | Exceptional 5.2% |
| Romanians | 95.3 /100 | #82 | Exceptional 5.2% |
Demographics Similar to Immigrants from Mexico by Unemployment Among Women with Children Under 18 years
In terms of unemployment among women with children under 18 years, the demographic groups most similar to Immigrants from Mexico are Yaqui (6.6%, a difference of 0.090%), Hispanic or Latino (6.6%, a difference of 0.29%), Guyanese (6.6%, a difference of 0.39%), British West Indian (6.6%, a difference of 0.43%), and Immigrants from West Indies (6.6%, a difference of 0.43%).
| Demographics | Rating | Rank | Unemployment Among Women with Children Under 18 years |
| Immigrants | Central America | 0.0 /100 | #305 | Tragic 6.5% |
| Immigrants | Guyana | 0.0 /100 | #306 | Tragic 6.5% |
| Belizeans | 0.0 /100 | #307 | Tragic 6.5% |
| Africans | 0.0 /100 | #308 | Tragic 6.5% |
| Ecuadorians | 0.0 /100 | #309 | Tragic 6.5% |
| Guyanese | 0.0 /100 | #310 | Tragic 6.6% |
| Yaqui | 0.0 /100 | #311 | Tragic 6.6% |
| Immigrants | Mexico | 0.0 /100 | #312 | Tragic 6.6% |
| Hispanics or Latinos | 0.0 /100 | #313 | Tragic 6.6% |
| British West Indians | 0.0 /100 | #314 | Tragic 6.6% |
| Immigrants | West Indies | 0.0 /100 | #315 | Tragic 6.6% |
| Immigrants | Ecuador | 0.0 /100 | #316 | Tragic 6.6% |
| Shoshone | 0.0 /100 | #317 | Tragic 6.6% |
| Alaska Natives | 0.0 /100 | #318 | Tragic 6.7% |
| Central American Indians | 0.0 /100 | #319 | Tragic 6.7% |