Immigrants from Armenia vs Immigrants from Asia Unemployment Among Ages 35 to 44 years
COMPARE
Immigrants from Armenia
Immigrants from Asia
Unemployment Among Ages 35 to 44 years
Unemployment Among Ages 35 to 44 years Comparison
Immigrants from Armenia
Immigrants from Asia
6.2%
UNEMPLOYMENT AMONG AGES 35 TO 44 YEARS
0.0/ 100
METRIC RATING
320th/ 347
METRIC RANK
4.4%
UNEMPLOYMENT AMONG AGES 35 TO 44 YEARS
95.6/ 100
METRIC RATING
82nd/ 347
METRIC RANK
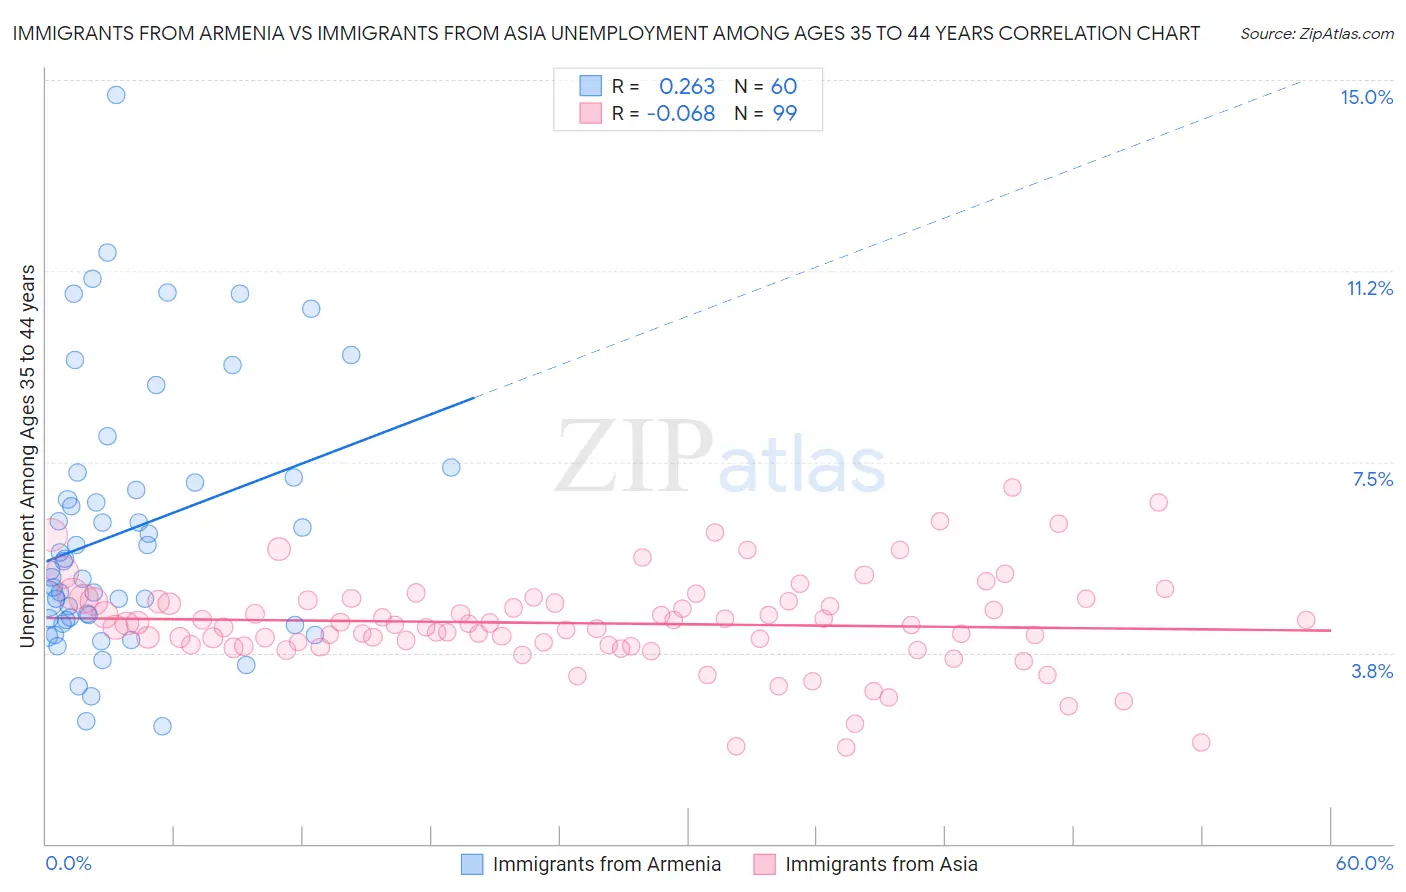
Immigrants from Armenia vs Immigrants from Asia Unemployment Among Ages 35 to 44 years Correlation Chart
The statistical analysis conducted on geographies consisting of 97,345,029 people shows a weak positive correlation between the proportion of Immigrants from Armenia and unemployment rate among population between the ages 35 and 44 in the United States with a correlation coefficient (R) of 0.263 and weighted average of 6.2%. Similarly, the statistical analysis conducted on geographies consisting of 520,063,038 people shows a slight negative correlation between the proportion of Immigrants from Asia and unemployment rate among population between the ages 35 and 44 in the United States with a correlation coefficient (R) of -0.068 and weighted average of 4.4%, a difference of 40.4%.
Unemployment Among Ages 35 to 44 years Correlation Summary
| Measurement | Immigrants from Armenia | Immigrants from Asia |
| Minimum | 2.3% | 1.9% |
| Maximum | 14.7% | 7.0% |
| Range | 12.4% | 5.1% |
| Mean | 6.2% | 4.3% |
| Median | 5.5% | 4.3% |
| Interquartile 25% (IQ1) | 4.4% | 3.9% |
| Interquartile 75% (IQ3) | 7.1% | 4.8% |
| Interquartile Range (IQR) | 2.7% | 0.88% |
| Standard Deviation (Sample) | 2.6% | 0.93% |
| Standard Deviation (Population) | 2.6% | 0.92% |
Similar Demographics by Unemployment Among Ages 35 to 44 years
Demographics Similar to Immigrants from Armenia by Unemployment Among Ages 35 to 44 years
In terms of unemployment among ages 35 to 44 years, the demographic groups most similar to Immigrants from Armenia are Chippewa (6.2%, a difference of 0.060%), Immigrants from Grenada (6.2%, a difference of 0.24%), Colville (6.2%, a difference of 0.49%), Immigrants from St. Vincent and the Grenadines (6.2%, a difference of 0.91%), and Tsimshian (6.2%, a difference of 1.1%).
| Demographics | Rating | Rank | Unemployment Among Ages 35 to 44 years |
| British West Indians | 0.0 /100 | #313 | Tragic 6.0% |
| Immigrants | Dominica | 0.0 /100 | #314 | Tragic 6.0% |
| Blacks/African Americans | 0.0 /100 | #315 | Tragic 6.1% |
| Tsimshian | 0.0 /100 | #316 | Tragic 6.2% |
| Immigrants | St. Vincent and the Grenadines | 0.0 /100 | #317 | Tragic 6.2% |
| Colville | 0.0 /100 | #318 | Tragic 6.2% |
| Immigrants | Grenada | 0.0 /100 | #319 | Tragic 6.2% |
| Immigrants | Armenia | 0.0 /100 | #320 | Tragic 6.2% |
| Chippewa | 0.0 /100 | #321 | Tragic 6.2% |
| Immigrants | Dominican Republic | 0.0 /100 | #322 | Tragic 6.4% |
| Dominicans | 0.0 /100 | #323 | Tragic 6.4% |
| Menominee | 0.0 /100 | #324 | Tragic 6.5% |
| Immigrants | Yemen | 0.0 /100 | #325 | Tragic 6.6% |
| Alaska Natives | 0.0 /100 | #326 | Tragic 6.6% |
| Cape Verdeans | 0.0 /100 | #327 | Tragic 6.6% |
Demographics Similar to Immigrants from Asia by Unemployment Among Ages 35 to 44 years
In terms of unemployment among ages 35 to 44 years, the demographic groups most similar to Immigrants from Asia are Immigrants from Scotland (4.4%, a difference of 0.010%), Kenyan (4.4%, a difference of 0.050%), Immigrants from Sweden (4.4%, a difference of 0.12%), Immigrants from Australia (4.4%, a difference of 0.14%), and Indian (Asian) (4.4%, a difference of 0.17%).
| Demographics | Rating | Rank | Unemployment Among Ages 35 to 44 years |
| Immigrants | Romania | 96.3 /100 | #75 | Exceptional 4.4% |
| Immigrants | Jordan | 96.3 /100 | #76 | Exceptional 4.4% |
| Dutch | 96.1 /100 | #77 | Exceptional 4.4% |
| Indians (Asian) | 96.0 /100 | #78 | Exceptional 4.4% |
| Immigrants | Sweden | 95.9 /100 | #79 | Exceptional 4.4% |
| Kenyans | 95.7 /100 | #80 | Exceptional 4.4% |
| Immigrants | Scotland | 95.6 /100 | #81 | Exceptional 4.4% |
| Immigrants | Asia | 95.6 /100 | #82 | Exceptional 4.4% |
| Immigrants | Australia | 95.3 /100 | #83 | Exceptional 4.4% |
| Immigrants | Chile | 95.2 /100 | #84 | Exceptional 4.4% |
| Immigrants | Kenya | 95.0 /100 | #85 | Exceptional 4.4% |
| Serbians | 94.9 /100 | #86 | Exceptional 4.4% |
| Immigrants | Bosnia and Herzegovina | 94.8 /100 | #87 | Exceptional 4.4% |
| Immigrants | Latvia | 94.8 /100 | #88 | Exceptional 4.4% |
| Egyptians | 94.5 /100 | #89 | Exceptional 4.5% |