Immigrants from Argentina vs Immigrants from Ghana Female Unemployment
COMPARE
Immigrants from Argentina
Immigrants from Ghana
Female Unemployment
Female Unemployment Comparison
Immigrants from Argentina
Immigrants from Ghana
5.2%
FEMALE UNEMPLOYMENT
78.7/ 100
METRIC RATING
148th/ 347
METRIC RANK
6.0%
FEMALE UNEMPLOYMENT
0.0/ 100
METRIC RATING
277th/ 347
METRIC RANK
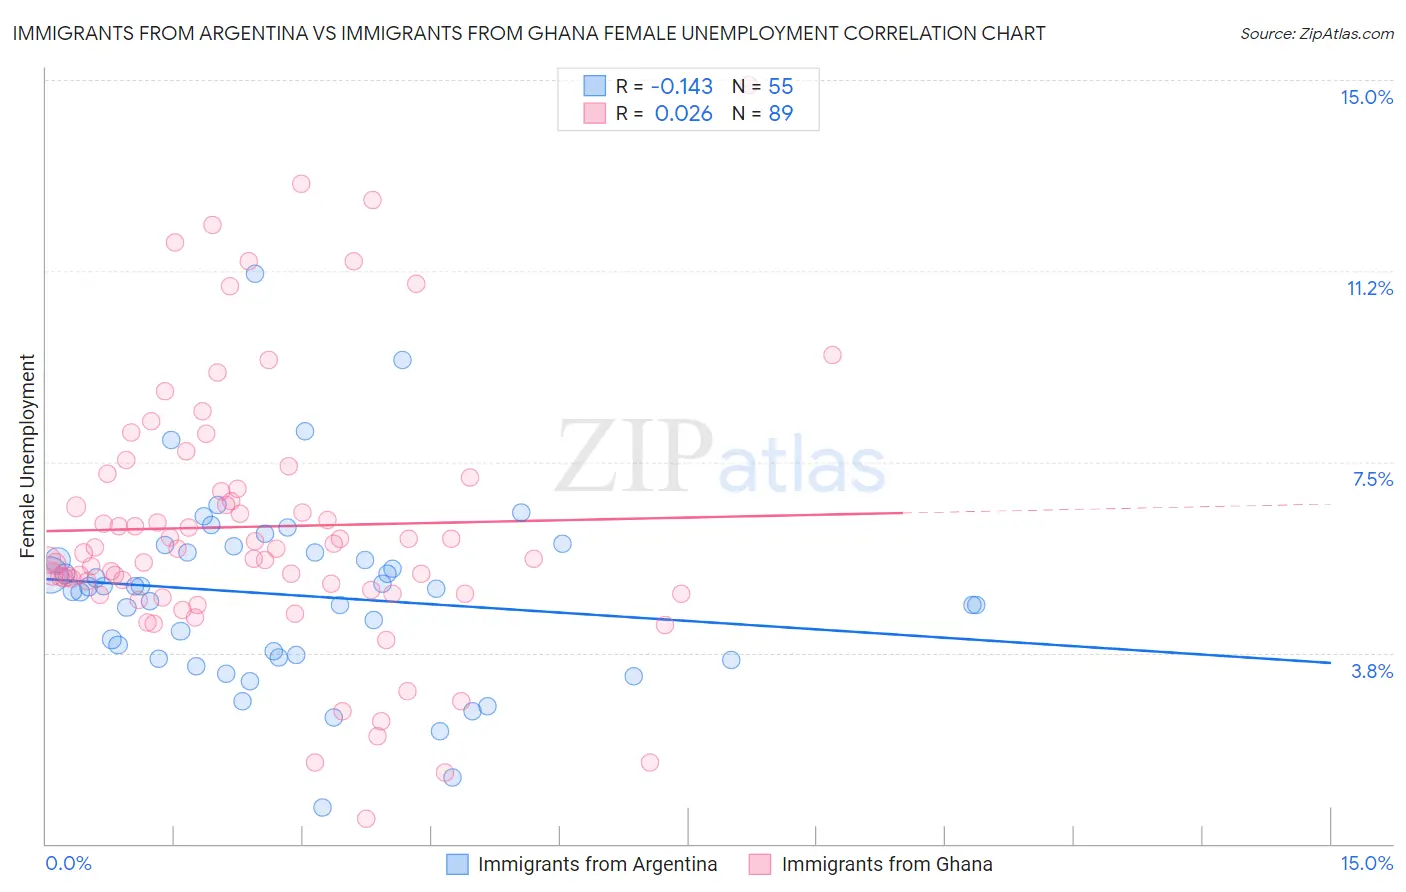
Immigrants from Argentina vs Immigrants from Ghana Female Unemployment Correlation Chart
The statistical analysis conducted on geographies consisting of 263,999,591 people shows a poor negative correlation between the proportion of Immigrants from Argentina and unemploymnet rate among females in the United States with a correlation coefficient (R) of -0.143 and weighted average of 5.2%. Similarly, the statistical analysis conducted on geographies consisting of 199,631,349 people shows no correlation between the proportion of Immigrants from Ghana and unemploymnet rate among females in the United States with a correlation coefficient (R) of 0.026 and weighted average of 6.0%, a difference of 16.5%.
Female Unemployment Correlation Summary
| Measurement | Immigrants from Argentina | Immigrants from Ghana |
| Minimum | 0.70% | 0.50% |
| Maximum | 11.2% | 14.9% |
| Range | 10.5% | 14.4% |
| Mean | 4.9% | 6.2% |
| Median | 5.0% | 5.7% |
| Interquartile 25% (IQ1) | 3.7% | 4.9% |
| Interquartile 75% (IQ3) | 5.7% | 7.1% |
| Interquartile Range (IQR) | 2.1% | 2.2% |
| Standard Deviation (Sample) | 1.8% | 2.6% |
| Standard Deviation (Population) | 1.8% | 2.6% |
Similar Demographics by Female Unemployment
Demographics Similar to Immigrants from Argentina by Female Unemployment
In terms of female unemployment, the demographic groups most similar to Immigrants from Argentina are Asian (5.2%, a difference of 0.030%), Egyptian (5.2%, a difference of 0.040%), Argentinean (5.2%, a difference of 0.050%), Immigrants from Norway (5.2%, a difference of 0.060%), and Immigrants from Oceania (5.2%, a difference of 0.070%).
| Demographics | Rating | Rank | Female Unemployment |
| Immigrants | Eastern Europe | 81.5 /100 | #141 | Excellent 5.1% |
| Palestinians | 80.8 /100 | #142 | Excellent 5.1% |
| Immigrants | Kazakhstan | 80.7 /100 | #143 | Excellent 5.1% |
| Immigrants | Jordan | 80.4 /100 | #144 | Excellent 5.1% |
| Immigrants | Oceania | 79.5 /100 | #145 | Good 5.2% |
| Immigrants | Norway | 79.4 /100 | #146 | Good 5.2% |
| Argentineans | 79.2 /100 | #147 | Good 5.2% |
| Immigrants | Argentina | 78.7 /100 | #148 | Good 5.2% |
| Asians | 78.3 /100 | #149 | Good 5.2% |
| Egyptians | 78.3 /100 | #150 | Good 5.2% |
| Immigrants | China | 75.9 /100 | #151 | Good 5.2% |
| Immigrants | Italy | 75.0 /100 | #152 | Good 5.2% |
| Immigrants | Greece | 74.9 /100 | #153 | Good 5.2% |
| South Africans | 70.8 /100 | #154 | Good 5.2% |
| Immigrants | Egypt | 70.0 /100 | #155 | Good 5.2% |
Demographics Similar to Immigrants from Ghana by Female Unemployment
In terms of female unemployment, the demographic groups most similar to Immigrants from Ghana are Yaqui (6.0%, a difference of 0.0%), Armenian (6.0%, a difference of 0.12%), Mexican American Indian (6.0%, a difference of 0.17%), Guatemalan (6.0%, a difference of 0.21%), and Bahamian (6.0%, a difference of 0.40%).
| Demographics | Rating | Rank | Female Unemployment |
| Immigrants | Honduras | 0.0 /100 | #270 | Tragic 5.9% |
| Central Americans | 0.0 /100 | #271 | Tragic 5.9% |
| Lumbee | 0.0 /100 | #272 | Tragic 5.9% |
| Ghanaians | 0.0 /100 | #273 | Tragic 5.9% |
| Africans | 0.0 /100 | #274 | Tragic 5.9% |
| Senegalese | 0.0 /100 | #275 | Tragic 6.0% |
| Bahamians | 0.0 /100 | #276 | Tragic 6.0% |
| Immigrants | Ghana | 0.0 /100 | #277 | Tragic 6.0% |
| Yaqui | 0.0 /100 | #278 | Tragic 6.0% |
| Armenians | 0.0 /100 | #279 | Tragic 6.0% |
| Mexican American Indians | 0.0 /100 | #280 | Tragic 6.0% |
| Guatemalans | 0.0 /100 | #281 | Tragic 6.0% |
| Colville | 0.0 /100 | #282 | Tragic 6.0% |
| Salvadorans | 0.0 /100 | #283 | Tragic 6.0% |
| Immigrants | Senegal | 0.0 /100 | #284 | Tragic 6.1% |