Immigrants from Argentina vs Czechoslovakian Unemployment Among Youth under 25 years

COMPARE

Immigrants from Argentina
Race
Ancestry
AfghanAfricanAlaska NativeAlaskan AthabascanAlbanianAleutAlsatianAmericanApacheArabArapahoArgentineanArmenianAssyrian/Chaldean/SyriacAustralianAustrianBahamianBangladeshiBarbadianBasqueBelgianBelizeanBermudanBhutaneseBlackfeetBolivianBrazilianBritishBritish West IndianBulgarianBurmeseCajunCambodianCanadianCape VerdeanCarpatho RusynCelticCentral AmericanCentral American IndianCherokeeCheyenneChickasawChileanChineseChippewaChoctawColombianColvilleComancheCosta RicanCreeCreekCroatianCrowCubanCypriotCzechDanishDelawareDominicanDutchDutch West IndianEastern EuropeanEcuadorianEgyptianEnglishEstonianEthiopianEuropeanFijianFilipinoFinnishFrenchFrench American IndianFrench CanadianGermanGerman RussianGhanaianGreekGuamanian/ChamorroGuatemalanGuyaneseHaitianHmongHonduranHopiHoumaHungarianIcelanderIndian (Asian)IndonesianInupiatIranianIraqiIrishIroquoisIsraeliItalianJamaicanJapaneseJordanianKenyanKiowaKoreanLaotianLatvianLebaneseLiberianLithuanianLumbeeLuxembourgerMacedonianMalaysianMalteseMarshalleseMenomineeMexicanMexican American IndianMongolianMoroccanNative HawaiianNavajoNepaleseNew ZealanderNicaraguanNigerianNorthern EuropeanNorwegianOkinawanOsageOttawaPaiutePakistaniPalestinianPanamanianParaguayanPennsylvania GermanPeruvianPimaPolishPortuguesePotawatomiPuebloPuerto RicanPuget Sound SalishRomanianRussianSalvadoranSamoanScandinavianScotch-IrishScottishSeminoleSenegaleseSerbianShoshoneSierra LeoneanSiouxSlavicSlovakSloveneSomaliSouth AfricanSouth AmericanSouth American IndianSoviet UnionSpaniardSpanishSpanish AmericanSpanish American IndianSri LankanSubsaharan AfricanSudaneseSwedishSwissSyrianTaiwaneseThaiTlingit-HaidaTohono O'OdhamTonganTrinidadian and TobagonianTsimshianTurkishU.S. Virgin IslanderUgandanUkrainianUruguayanUteVenezuelanVietnameseWelshWest IndianYakamaYaquiYugoslavianYumanYup'ikZimbabwean
Immigration
NonimmigrantsImmigrantsAfghanistanAfricaAlbaniaArgentinaArmeniaAsiaAustraliaAustriaBahamasBangladeshBarbadosBelarusBelgiumBelizeBoliviaBosnia and HerzegovinaBrazilBulgariaBurma/MyanmarCabo VerdeCambodiaCameroonCanadaCaribbeanCentral AmericaChileChinaColombiaCongoCosta RicaCroatiaCubaCzechoslovakiaDenmarkDominicaDominican RepublicEastern AfricaEastern AsiaEastern EuropeEcuadorEgyptEl SalvadorEnglandEritreaEthiopiaEuropeFijiFranceGermanyGhanaGreeceGrenadaGuatemalaGuyanaHaitiHondurasHong KongHungaryIndiaIndonesiaIranIraqIrelandIsraelItalyJamaicaJapanJordanKazakhstanKenyaKoreaKuwaitLaosLatin AmericaLatviaLebanonLiberiaLithuaniaMalaysiaMexicoMicronesiaMiddle AfricaMoldovaMoroccoNepalNetherlandsNicaraguaNigeriaNorth AmericaNorth MacedoniaNorthern AfricaNorthern EuropeNorwayOceaniaPakistanPanamaPeruPhilippinesPolandPortugalRomaniaRussiaSaudi ArabiaScotlandSenegalSerbiaSierra LeoneSingaporeSomaliaSouth AfricaSouth AmericaSouth Central AsiaSouth Eastern AsiaSouthern EuropeSpainSri LankaSt. Vincent and the GrenadinesSudanSwedenSwitzerlandSyriaTaiwanThailandTrinidad and TobagoTurkeyUgandaUkraineUruguayUzbekistanVenezuelaVietnamWest IndiesWestern AfricaWestern AsiaWestern EuropeYemenZaireZimbabweAzores
Czechoslovakian
Race
Ancestry
AfghanAfricanAlaska NativeAlaskan AthabascanAlbanianAleutAlsatianAmericanApacheArabArapahoArgentineanArmenianAssyrian/Chaldean/SyriacAustralianAustrianBahamianBangladeshiBarbadianBasqueBelgianBelizeanBermudanBhutaneseBlackfeetBolivianBrazilianBritishBritish West IndianBulgarianBurmeseCajunCambodianCanadianCape VerdeanCarpatho RusynCelticCentral AmericanCentral American IndianCherokeeCheyenneChickasawChileanChineseChippewaChoctawColombianColvilleComancheCosta RicanCreeCreekCroatianCrowCubanCypriotCzechCzechoslovakianDanishDelawareDominicanDutchDutch West IndianEastern EuropeanEcuadorianEgyptianEnglishEstonianEthiopianEuropeanFijianFilipinoFinnishFrenchFrench American IndianFrench CanadianGermanGerman RussianGhanaianGreekGuamanian/ChamorroGuatemalanGuyaneseHaitianHmongHonduranHopiHoumaHungarianIcelanderIndian (Asian)IndonesianInupiatIranianIraqiIrishIroquoisIsraeliItalianJamaicanJapaneseJordanianKenyanKiowaKoreanLaotianLatvianLebaneseLiberianLithuanianLumbeeLuxembourgerMacedonianMalaysianMalteseMarshalleseMenomineeMexicanMexican American IndianMongolianMoroccanNative HawaiianNavajoNepaleseNew ZealanderNicaraguanNigerianNorthern EuropeanNorwegianOkinawanOsageOttawaPaiutePakistaniPalestinianPanamanianParaguayanPennsylvania GermanPeruvianPimaPolishPortuguesePotawatomiPuebloPuerto RicanPuget Sound SalishRomanianRussianSalvadoranSamoanScandinavianScotch-IrishScottishSeminoleSenegaleseSerbianShoshoneSierra LeoneanSiouxSlavicSlovakSloveneSomaliSouth AfricanSouth AmericanSouth American IndianSoviet UnionSpaniardSpanishSpanish AmericanSpanish American IndianSri LankanSubsaharan AfricanSudaneseSwedishSwissSyrianTaiwaneseThaiTlingit-HaidaTohono O'OdhamTonganTrinidadian and TobagonianTsimshianTurkishU.S. Virgin IslanderUgandanUkrainianUruguayanUteVenezuelanVietnameseWelshWest IndianYakamaYaquiYugoslavianYumanYup'ikZimbabwean
Immigration
NonimmigrantsImmigrantsAfghanistanAfricaAlbaniaArmeniaAsiaAustraliaAustriaBahamasBangladeshBarbadosBelarusBelgiumBelizeBoliviaBosnia and HerzegovinaBrazilBulgariaBurma/MyanmarCabo VerdeCambodiaCameroonCanadaCaribbeanCentral AmericaChileChinaColombiaCongoCosta RicaCroatiaCubaCzechoslovakiaDenmarkDominicaDominican RepublicEastern AfricaEastern AsiaEastern EuropeEcuadorEgyptEl SalvadorEnglandEritreaEthiopiaEuropeFijiFranceGermanyGhanaGreeceGrenadaGuatemalaGuyanaHaitiHondurasHong KongHungaryIndiaIndonesiaIranIraqIrelandIsraelItalyJamaicaJapanJordanKazakhstanKenyaKoreaKuwaitLaosLatin AmericaLatviaLebanonLiberiaLithuaniaMalaysiaMexicoMicronesiaMiddle AfricaMoldovaMoroccoNepalNetherlandsNicaraguaNigeriaNorth AmericaNorth MacedoniaNorthern AfricaNorthern EuropeNorwayOceaniaPakistanPanamaPeruPhilippinesPolandPortugalRomaniaRussiaSaudi ArabiaScotlandSenegalSerbiaSierra LeoneSingaporeSomaliaSouth AfricaSouth AmericaSouth Central AsiaSouth Eastern AsiaSouthern EuropeSpainSri LankaSt. Vincent and the GrenadinesSudanSwedenSwitzerlandSyriaTaiwanThailandTrinidad and TobagoTurkeyUgandaUkraineUruguayUzbekistanVenezuelaVietnamWest IndiesWestern AfricaWestern AsiaWestern EuropeYemenZaireZimbabweAzores
Unemployment Among Youth under 25 years
Income
Poverty
Unemployment
Labor Participation
Family Structure
Vehicle Availability
Education Level
Disability

Unemployment Among Youth under 25 years Comparison

Immigrants from Argentina

Czechoslovakians

Excellent
Exceptional
11.4%
UNEMPLOYMENT AMONG YOUTH UNDER 25 YEARS
87.2/ 100
METRIC RATING
125th/ 347
METRIC RANK
11.0%
UNEMPLOYMENT AMONG YOUTH UNDER 25 YEARS
99.2/ 100
METRIC RATING
50th/ 347
METRIC RANK

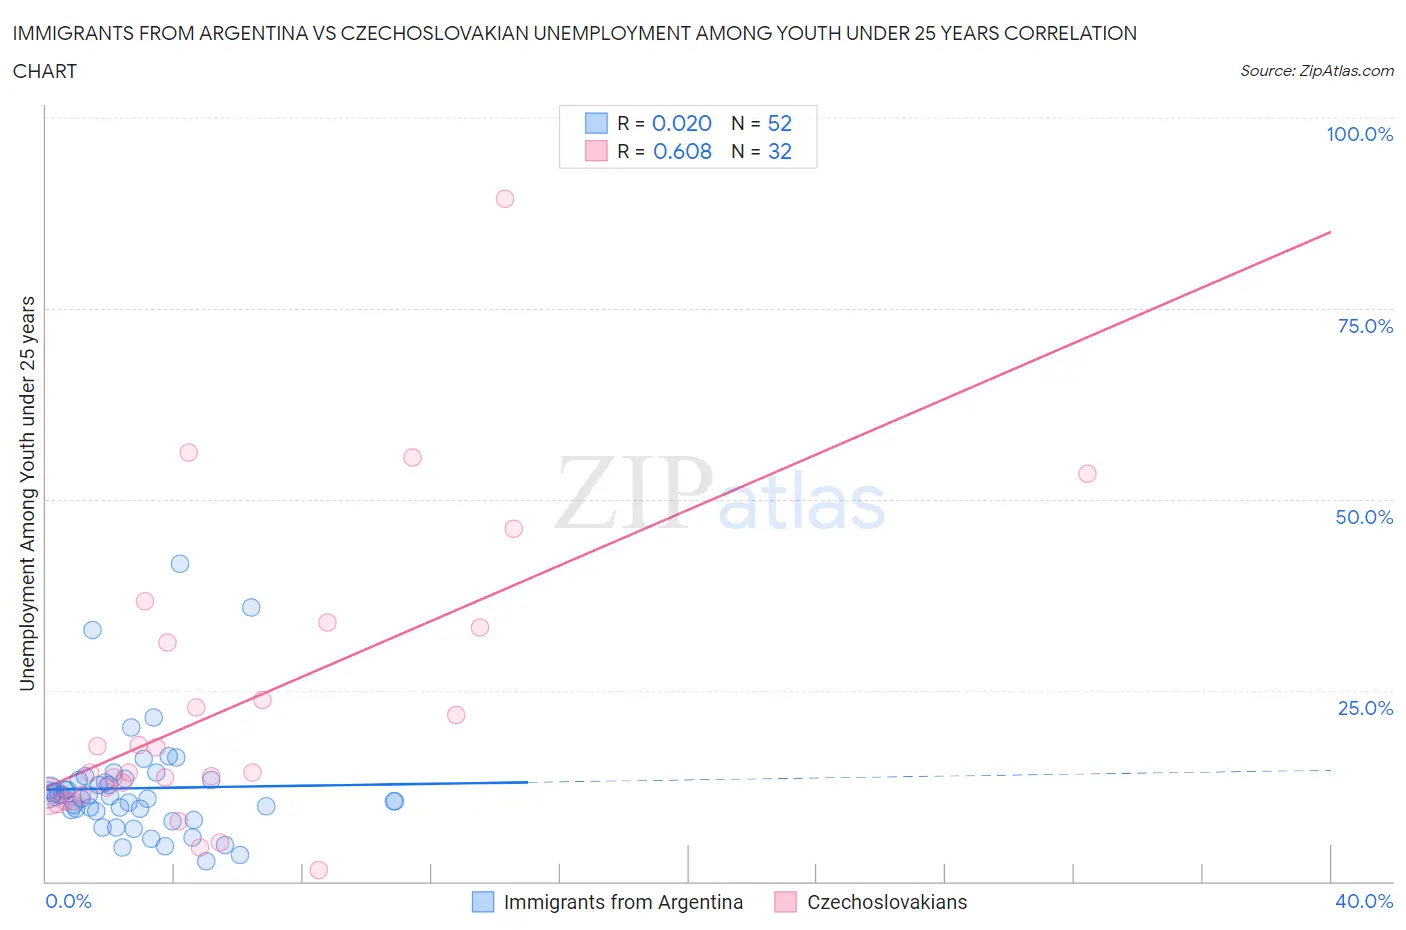
Immigrants from Argentina vs Czechoslovakian Unemployment Among Youth under 25 years Correlation Chart

The statistical analysis conducted on geographies consisting of 262,817,431 people shows no correlation between the proportion of Immigrants from Argentina and unemployment rate among youth under the age of 25 in the United States with a correlation coefficient (R) of 0.020 and weighted average of 11.4%. Similarly, the statistical analysis conducted on geographies consisting of 362,760,645 people shows a significant positive correlation between the proportion of Czechoslovakians and unemployment rate among youth under the age of 25 in the United States with a correlation coefficient (R) of 0.608 and weighted average of 11.0%, a difference of 3.2%.
Immigrants from Argentina vs Czechoslovakian Unemployment Among Youth under 25 years

Unemployment Among Youth under 25 years Correlation Summary

MeasurementImmigrants from ArgentinaCzechoslovakian
Minimum2.7%1.4%
Maximum41.6%89.4%
Range38.9%88.0%
Mean12.2%23.1%
Median11.1%14.3%
Interquartile 25% (IQ1)9.3%11.2%
Interquartile 75% (IQ3)13.2%32.3%
Interquartile Range (IQR)4.0%21.0%
Standard Deviation (Sample)7.2%19.2%
Standard Deviation (Population)7.2%18.9%

Similar Demographics by Unemployment Among Youth under 25 years

Demographics Similar to Immigrants from Argentina by Unemployment Among Youth under 25 years

In terms of unemployment among youth under 25 years, the demographic groups most similar to Immigrants from Argentina are Italian (11.4%, a difference of 0.0%), Canadian (11.4%, a difference of 0.050%), Basque (11.4%, a difference of 0.070%), Immigrants from Micronesia (11.4%, a difference of 0.090%), and Greek (11.4%, a difference of 0.090%).
DemographicsRating | RankUnemployment Among Youth under 25 years
Afghans
89.7
/100
|
#118
Excellent
11.3%
Immigrants | Scotland
89.2
/100
|
#119
Excellent
11.4%
Malaysians
89.0
/100
|
#120
Excellent
11.4%
Slovaks
88.9
/100
|
#121
Excellent
11.4%
Immigrants | Micronesia
88.1
/100
|
#122
Excellent
11.4%
Basques
87.8
/100
|
#123
Excellent
11.4%
Italians
87.2
/100
|
#124
Excellent
11.4%
Immigrants | Argentina
87.2
/100
|
#125
Excellent
11.4%
Canadians
86.6
/100
|
#126
Excellent
11.4%
Greeks
86.2
/100
|
#127
Excellent
11.4%
Immigrants | Hungary
86.0
/100
|
#128
Excellent
11.4%
Turks
85.8
/100
|
#129
Excellent
11.4%
Hungarians
85.7
/100
|
#130
Excellent
11.4%
Immigrants | Spain
84.6
/100
|
#131
Excellent
11.4%
Ethiopians
83.2
/100
|
#132
Excellent
11.4%

Demographics Similar to Czechoslovakians by Unemployment Among Youth under 25 years

In terms of unemployment among youth under 25 years, the demographic groups most similar to Czechoslovakians are Thai (11.0%, a difference of 0.090%), Polish (11.0%, a difference of 0.17%), Serbian (11.0%, a difference of 0.23%), Latvian (11.0%, a difference of 0.25%), and Ottawa (11.1%, a difference of 0.34%).
DemographicsRating | RankUnemployment Among Youth under 25 years
British
99.7
/100
|
#43
Exceptional
10.9%
Welsh
99.7
/100
|
#44
Exceptional
10.9%
Bulgarians
99.6
/100
|
#45
Exceptional
10.9%
Tongans
99.6
/100
|
#46
Exceptional
10.9%
Australians
99.6
/100
|
#47
Exceptional
10.9%
Poles
99.3
/100
|
#48
Exceptional
11.0%
Thais
99.3
/100
|
#49
Exceptional
11.0%
Czechoslovakians
99.2
/100
|
#50
Exceptional
11.0%
Serbians
99.0
/100
|
#51
Exceptional
11.0%
Latvians
99.0
/100
|
#52
Exceptional
11.0%
Ottawa
99.0
/100
|
#53
Exceptional
11.1%
Mongolians
98.9
/100
|
#54
Exceptional
11.1%
Irish
98.9
/100
|
#55
Exceptional
11.1%
Immigrants | Saudi Arabia
98.8
/100
|
#56
Exceptional
11.1%
Immigrants | Eritrea
98.8
/100
|
#57
Exceptional
11.1%