Immigrants from Albania vs South American Indian Unemployment Among Ages 30 to 34 years
COMPARE
Immigrants from Albania
South American Indian
Unemployment Among Ages 30 to 34 years
Unemployment Among Ages 30 to 34 years Comparison
Immigrants from Albania
South American Indians
5.3%
UNEMPLOYMENT AMONG AGES 30 TO 34 YEARS
83.4/ 100
METRIC RATING
115th/ 347
METRIC RANK
5.6%
UNEMPLOYMENT AMONG AGES 30 TO 34 YEARS
24.4/ 100
METRIC RATING
201st/ 347
METRIC RANK
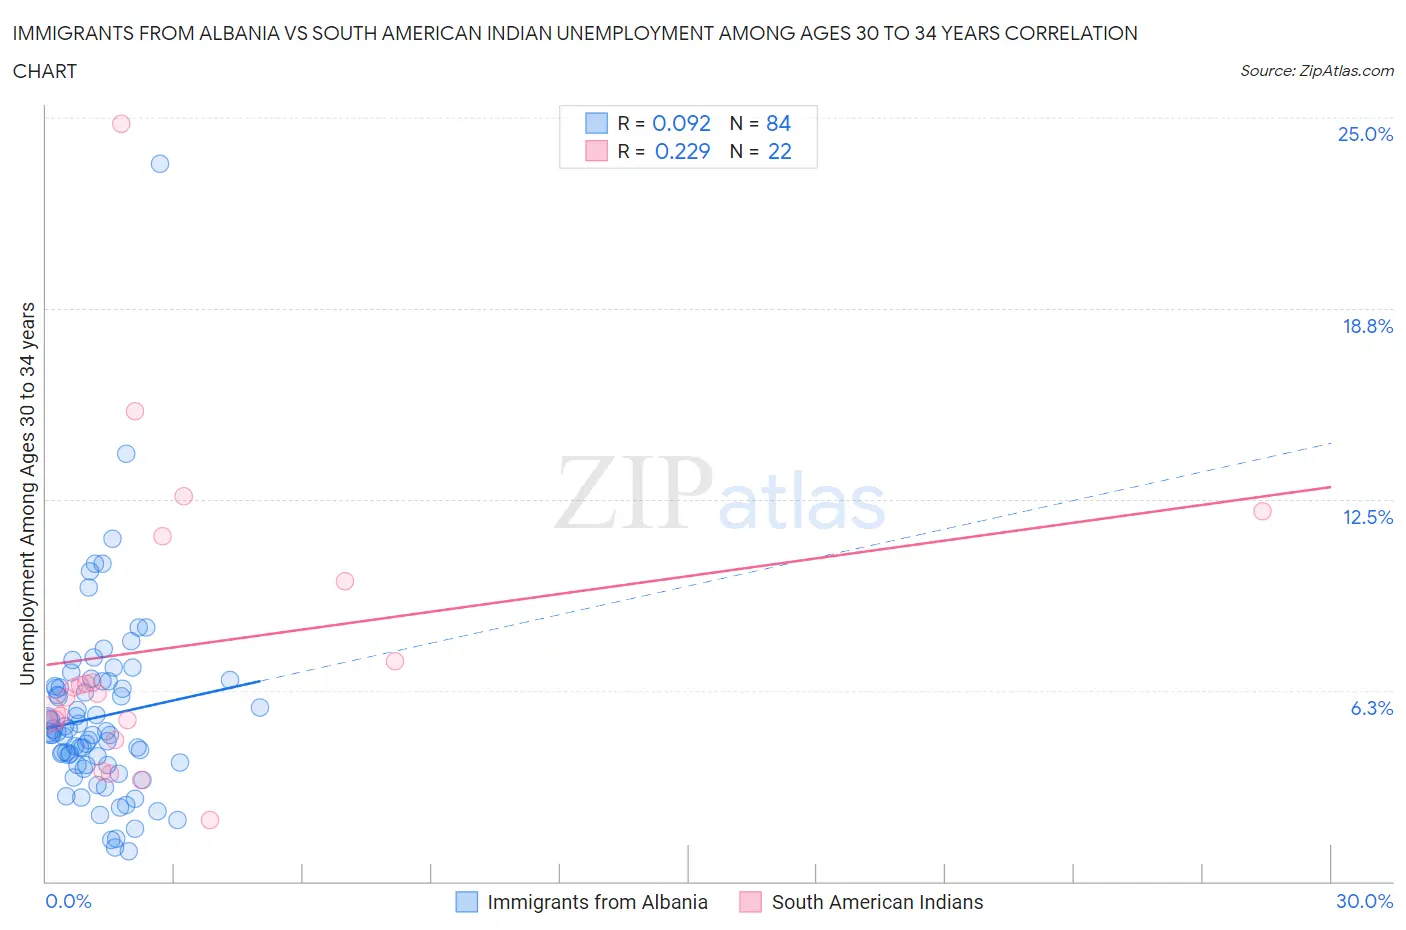
Immigrants from Albania vs South American Indian Unemployment Among Ages 30 to 34 years Correlation Chart
The statistical analysis conducted on geographies consisting of 116,393,564 people shows a slight positive correlation between the proportion of Immigrants from Albania and unemployment rate among population between the ages 30 and 34 in the United States with a correlation coefficient (R) of 0.092 and weighted average of 5.3%. Similarly, the statistical analysis conducted on geographies consisting of 161,720,998 people shows a weak positive correlation between the proportion of South American Indians and unemployment rate among population between the ages 30 and 34 in the United States with a correlation coefficient (R) of 0.229 and weighted average of 5.6%, a difference of 4.9%.
Unemployment Among Ages 30 to 34 years Correlation Summary
| Measurement | Immigrants from Albania | South American Indian |
| Minimum | 1.0% | 2.0% |
| Maximum | 23.5% | 24.8% |
| Range | 22.5% | 22.8% |
| Mean | 5.4% | 7.7% |
| Median | 4.8% | 6.2% |
| Interquartile 25% (IQ1) | 3.8% | 5.3% |
| Interquartile 75% (IQ3) | 6.4% | 9.8% |
| Interquartile Range (IQR) | 2.6% | 4.5% |
| Standard Deviation (Sample) | 3.1% | 5.1% |
| Standard Deviation (Population) | 3.1% | 5.0% |
Similar Demographics by Unemployment Among Ages 30 to 34 years
Demographics Similar to Immigrants from Albania by Unemployment Among Ages 30 to 34 years
In terms of unemployment among ages 30 to 34 years, the demographic groups most similar to Immigrants from Albania are Eastern European (5.3%, a difference of 0.030%), Estonian (5.3%, a difference of 0.040%), Australian (5.3%, a difference of 0.040%), Immigrants from South Africa (5.3%, a difference of 0.050%), and New Zealander (5.3%, a difference of 0.11%).
| Demographics | Rating | Rank | Unemployment Among Ages 30 to 34 years |
| Immigrants | Middle Africa | 87.1 /100 | #108 | Excellent 5.3% |
| Immigrants | Chile | 86.7 /100 | #109 | Excellent 5.3% |
| Egyptians | 86.4 /100 | #110 | Excellent 5.3% |
| Immigrants | Pakistan | 86.2 /100 | #111 | Excellent 5.3% |
| Swiss | 85.9 /100 | #112 | Excellent 5.3% |
| Immigrants | Spain | 85.6 /100 | #113 | Excellent 5.3% |
| Estonians | 83.7 /100 | #114 | Excellent 5.3% |
| Immigrants | Albania | 83.4 /100 | #115 | Excellent 5.3% |
| Eastern Europeans | 83.2 /100 | #116 | Excellent 5.3% |
| Australians | 83.1 /100 | #117 | Excellent 5.3% |
| Immigrants | South Africa | 83.0 /100 | #118 | Excellent 5.3% |
| New Zealanders | 82.5 /100 | #119 | Excellent 5.3% |
| Immigrants | Poland | 82.4 /100 | #120 | Excellent 5.3% |
| Romanians | 82.3 /100 | #121 | Excellent 5.3% |
| Immigrants | Netherlands | 81.8 /100 | #122 | Excellent 5.3% |
Demographics Similar to South American Indians by Unemployment Among Ages 30 to 34 years
In terms of unemployment among ages 30 to 34 years, the demographic groups most similar to South American Indians are Immigrants from Southern Europe (5.6%, a difference of 0.13%), Immigrants from Germany (5.6%, a difference of 0.14%), Nicaraguan (5.6%, a difference of 0.20%), Immigrants from Afghanistan (5.6%, a difference of 0.25%), and Korean (5.6%, a difference of 0.36%).
| Demographics | Rating | Rank | Unemployment Among Ages 30 to 34 years |
| Slavs | 30.9 /100 | #194 | Fair 5.5% |
| Finns | 30.7 /100 | #195 | Fair 5.5% |
| Immigrants | South America | 29.8 /100 | #196 | Fair 5.5% |
| Immigrants | Nicaragua | 28.9 /100 | #197 | Fair 5.5% |
| Immigrants | Afghanistan | 27.2 /100 | #198 | Fair 5.6% |
| Nicaraguans | 26.6 /100 | #199 | Fair 5.6% |
| Immigrants | Southern Europe | 25.8 /100 | #200 | Fair 5.6% |
| South American Indians | 24.4 /100 | #201 | Fair 5.6% |
| Immigrants | Germany | 22.9 /100 | #202 | Fair 5.6% |
| Koreans | 20.7 /100 | #203 | Fair 5.6% |
| Immigrants | Cameroon | 18.4 /100 | #204 | Poor 5.6% |
| Immigrants | Costa Rica | 14.4 /100 | #205 | Poor 5.6% |
| Alsatians | 14.3 /100 | #206 | Poor 5.6% |
| Israelis | 12.8 /100 | #207 | Poor 5.6% |
| Immigrants | Philippines | 11.5 /100 | #208 | Poor 5.7% |