Icelander vs Scandinavian Unemployment Among Ages 25 to 29 years
COMPARE
Icelander
Scandinavian
Unemployment Among Ages 25 to 29 years
Unemployment Among Ages 25 to 29 years Comparison
Icelanders
Scandinavians
6.3%
UNEMPLOYMENT AMONG AGES 25 TO 29 YEARS
96.6/ 100
METRIC RATING
77th/ 347
METRIC RANK
6.3%
UNEMPLOYMENT AMONG AGES 25 TO 29 YEARS
97.4/ 100
METRIC RATING
72nd/ 347
METRIC RANK
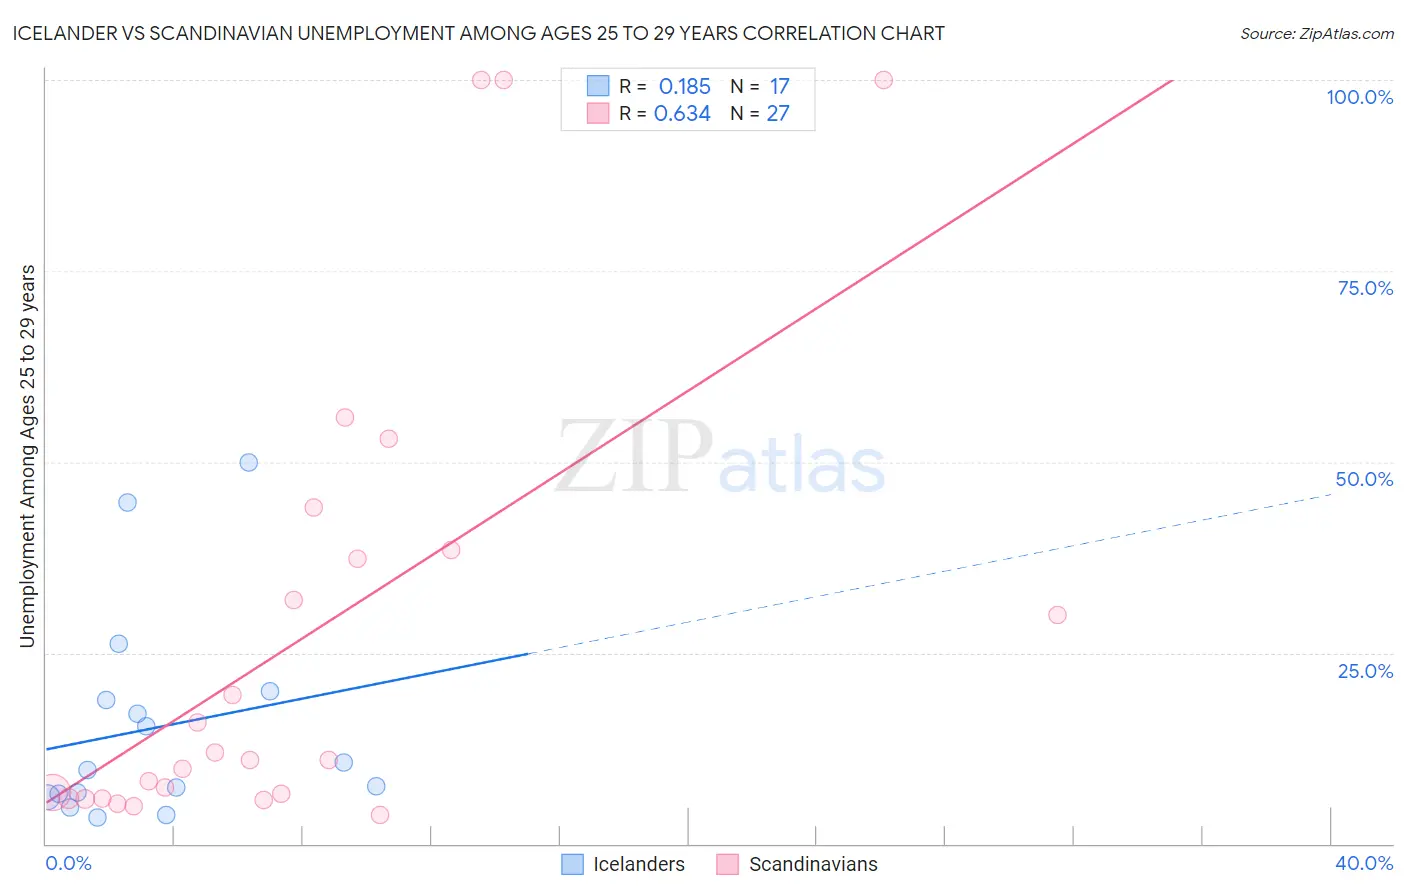
Icelander vs Scandinavian Unemployment Among Ages 25 to 29 years Correlation Chart
The statistical analysis conducted on geographies consisting of 154,630,748 people shows a poor positive correlation between the proportion of Icelanders and unemployment rate among population between the ages 25 and 29 in the United States with a correlation coefficient (R) of 0.185 and weighted average of 6.3%. Similarly, the statistical analysis conducted on geographies consisting of 433,811,713 people shows a significant positive correlation between the proportion of Scandinavians and unemployment rate among population between the ages 25 and 29 in the United States with a correlation coefficient (R) of 0.634 and weighted average of 6.3%, a difference of 0.43%.
Unemployment Among Ages 25 to 29 years Correlation Summary
| Measurement | Icelander | Scandinavian |
| Minimum | 3.5% | 3.8% |
| Maximum | 50.0% | 100.0% |
| Range | 46.5% | 96.2% |
| Mean | 15.2% | 27.3% |
| Median | 9.6% | 11.0% |
| Interquartile 25% (IQ1) | 6.3% | 6.0% |
| Interquartile 75% (IQ3) | 19.4% | 38.5% |
| Interquartile Range (IQR) | 13.1% | 32.5% |
| Standard Deviation (Sample) | 13.7% | 30.5% |
| Standard Deviation (Population) | 13.3% | 29.9% |
Demographics Similar to Icelanders and Scandinavians by Unemployment Among Ages 25 to 29 years
In terms of unemployment among ages 25 to 29 years, the demographic groups most similar to Icelanders are Immigrants from Korea (6.3%, a difference of 0.020%), Immigrants from Jordan (6.3%, a difference of 0.080%), Asian (6.3%, a difference of 0.10%), Carpatho Rusyn (6.3%, a difference of 0.16%), and Belgian (6.3%, a difference of 0.18%). Similarly, the demographic groups most similar to Scandinavians are Immigrants from France (6.3%, a difference of 0.020%), Immigrants from Malaysia (6.3%, a difference of 0.060%), Immigrants from Hong Kong (6.3%, a difference of 0.080%), Belgian (6.3%, a difference of 0.25%), and Palestinian (6.3%, a difference of 0.26%).
| Demographics | Rating | Rank | Unemployment Among Ages 25 to 29 years |
| Immigrants | Sri Lanka | 97.9 /100 | #64 | Exceptional 6.3% |
| Immigrants | Lebanon | 97.8 /100 | #65 | Exceptional 6.3% |
| Indians (Asian) | 97.8 /100 | #66 | Exceptional 6.3% |
| Immigrants | Northern Africa | 97.8 /100 | #67 | Exceptional 6.3% |
| Palestinians | 97.7 /100 | #68 | Exceptional 6.3% |
| Immigrants | Hong Kong | 97.5 /100 | #69 | Exceptional 6.3% |
| Immigrants | Malaysia | 97.5 /100 | #70 | Exceptional 6.3% |
| Immigrants | France | 97.4 /100 | #71 | Exceptional 6.3% |
| Scandinavians | 97.4 /100 | #72 | Exceptional 6.3% |
| Belgians | 97.0 /100 | #73 | Exceptional 6.3% |
| Carpatho Rusyns | 96.9 /100 | #74 | Exceptional 6.3% |
| Immigrants | Jordan | 96.8 /100 | #75 | Exceptional 6.3% |
| Immigrants | Korea | 96.7 /100 | #76 | Exceptional 6.3% |
| Icelanders | 96.6 /100 | #77 | Exceptional 6.3% |
| Asians | 96.4 /100 | #78 | Exceptional 6.3% |
| Immigrants | Switzerland | 96.0 /100 | #79 | Exceptional 6.3% |
| Immigrants | Romania | 95.9 /100 | #80 | Exceptional 6.3% |
| Iranians | 95.8 /100 | #81 | Exceptional 6.3% |
| Immigrants | Poland | 95.7 /100 | #82 | Exceptional 6.3% |
| Slovenes | 95.3 /100 | #83 | Exceptional 6.3% |
| Immigrants | Spain | 95.2 /100 | #84 | Exceptional 6.3% |