Hungarian vs Polish Unemployment Among Ages 65 to 74 years

COMPARE

Hungarian
Race
Ancestry
AfghanAfricanAlaska NativeAlaskan AthabascanAlbanianAleutAlsatianAmericanApacheArabArapahoArgentineanArmenianAssyrian/Chaldean/SyriacAustralianAustrianBahamianBangladeshiBarbadianBasqueBelgianBelizeanBermudanBhutaneseBlackfeetBolivianBrazilianBritishBritish West IndianBulgarianBurmeseCajunCambodianCanadianCape VerdeanCarpatho RusynCelticCentral AmericanCentral American IndianCherokeeCheyenneChickasawChileanChineseChippewaChoctawColombianColvilleComancheCosta RicanCreeCreekCroatianCrowCubanCypriotCzechCzechoslovakianDanishDelawareDominicanDutchDutch West IndianEastern EuropeanEcuadorianEgyptianEnglishEstonianEthiopianEuropeanFijianFilipinoFinnishFrenchFrench American IndianFrench CanadianGermanGerman RussianGhanaianGreekGuamanian/ChamorroGuatemalanGuyaneseHaitianHmongHonduranHopiHoumaHungarianIcelanderIndian (Asian)IndonesianInupiatIranianIraqiIrishIroquoisIsraeliItalianJamaicanJapaneseJordanianKenyanKiowaKoreanLaotianLatvianLebaneseLiberianLithuanianLumbeeLuxembourgerMacedonianMalaysianMalteseMarshalleseMenomineeMexicanMexican American IndianMongolianMoroccanNative HawaiianNavajoNepaleseNew ZealanderNicaraguanNigerianNorthern EuropeanNorwegianOkinawanOsageOttawaPaiutePakistaniPalestinianPanamanianParaguayanPennsylvania GermanPeruvianPimaPortuguesePotawatomiPuebloPuerto RicanPuget Sound SalishRomanianRussianSalvadoranSamoanScandinavianScotch-IrishScottishSeminoleSenegaleseSerbianShoshoneSierra LeoneanSiouxSlavicSlovakSloveneSomaliSouth AfricanSouth AmericanSouth American IndianSoviet UnionSpaniardSpanishSpanish AmericanSpanish American IndianSri LankanSubsaharan AfricanSudaneseSwedishSwissSyrianTaiwaneseThaiTlingit-HaidaTohono O'OdhamTonganTrinidadian and TobagonianTsimshianTurkishU.S. Virgin IslanderUgandanUkrainianUruguayanUteVenezuelanVietnameseWelshWest IndianYakamaYaquiYugoslavianYumanYup'ikZimbabwean
Immigration
NonimmigrantsImmigrantsAfghanistanAfricaAlbaniaArgentinaArmeniaAsiaAustraliaAustriaBahamasBangladeshBarbadosBelarusBelgiumBelizeBoliviaBosnia and HerzegovinaBrazilBulgariaBurma/MyanmarCabo VerdeCambodiaCameroonCanadaCaribbeanCentral AmericaChileChinaColombiaCongoCosta RicaCroatiaCubaCzechoslovakiaDenmarkDominicaDominican RepublicEastern AfricaEastern AsiaEastern EuropeEcuadorEgyptEl SalvadorEnglandEritreaEthiopiaEuropeFijiFranceGermanyGhanaGreeceGrenadaGuatemalaGuyanaHaitiHondurasHong KongHungaryIndiaIndonesiaIranIraqIrelandIsraelItalyJamaicaJapanJordanKazakhstanKenyaKoreaKuwaitLaosLatin AmericaLatviaLebanonLiberiaLithuaniaMalaysiaMexicoMicronesiaMiddle AfricaMoldovaMoroccoNepalNetherlandsNicaraguaNigeriaNorth AmericaNorth MacedoniaNorthern AfricaNorthern EuropeNorwayOceaniaPakistanPanamaPeruPhilippinesPolandPortugalRomaniaRussiaSaudi ArabiaScotlandSenegalSerbiaSierra LeoneSingaporeSomaliaSouth AfricaSouth AmericaSouth Central AsiaSouth Eastern AsiaSouthern EuropeSpainSri LankaSt. Vincent and the GrenadinesSudanSwedenSwitzerlandSyriaTaiwanThailandTrinidad and TobagoTurkeyUgandaUkraineUruguayUzbekistanVenezuelaVietnamWest IndiesWestern AfricaWestern AsiaWestern EuropeYemenZaireZimbabweAzores
Polish
Race
Ancestry
AfghanAfricanAlaska NativeAlaskan AthabascanAlbanianAleutAlsatianAmericanApacheArabArapahoArgentineanArmenianAssyrian/Chaldean/SyriacAustralianAustrianBahamianBangladeshiBarbadianBasqueBelgianBelizeanBermudanBhutaneseBlackfeetBolivianBrazilianBritishBritish West IndianBulgarianBurmeseCajunCambodianCanadianCape VerdeanCarpatho RusynCelticCentral AmericanCentral American IndianCherokeeCheyenneChickasawChileanChineseChippewaChoctawColombianColvilleComancheCosta RicanCreeCreekCroatianCrowCubanCypriotCzechCzechoslovakianDanishDelawareDominicanDutchDutch West IndianEastern EuropeanEcuadorianEgyptianEnglishEstonianEthiopianEuropeanFijianFilipinoFinnishFrenchFrench American IndianFrench CanadianGermanGerman RussianGhanaianGreekGuamanian/ChamorroGuatemalanGuyaneseHaitianHmongHonduranHopiHoumaIcelanderIndian (Asian)IndonesianInupiatIranianIraqiIrishIroquoisIsraeliItalianJamaicanJapaneseJordanianKenyanKiowaKoreanLaotianLatvianLebaneseLiberianLithuanianLumbeeLuxembourgerMacedonianMalaysianMalteseMarshalleseMenomineeMexicanMexican American IndianMongolianMoroccanNative HawaiianNavajoNepaleseNew ZealanderNicaraguanNigerianNorthern EuropeanNorwegianOkinawanOsageOttawaPaiutePakistaniPalestinianPanamanianParaguayanPennsylvania GermanPeruvianPimaPolishPortuguesePotawatomiPuebloPuerto RicanPuget Sound SalishRomanianRussianSalvadoranSamoanScandinavianScotch-IrishScottishSeminoleSenegaleseSerbianShoshoneSierra LeoneanSiouxSlavicSlovakSloveneSomaliSouth AfricanSouth AmericanSouth American IndianSoviet UnionSpaniardSpanishSpanish AmericanSpanish American IndianSri LankanSubsaharan AfricanSudaneseSwedishSwissSyrianTaiwaneseThaiTlingit-HaidaTohono O'OdhamTonganTrinidadian and TobagonianTsimshianTurkishU.S. Virgin IslanderUgandanUkrainianUruguayanUteVenezuelanVietnameseWelshWest IndianYakamaYaquiYugoslavianYumanYup'ikZimbabwean
Immigration
NonimmigrantsImmigrantsAfghanistanAfricaAlbaniaArgentinaArmeniaAsiaAustraliaAustriaBahamasBangladeshBarbadosBelarusBelgiumBelizeBoliviaBosnia and HerzegovinaBrazilBulgariaBurma/MyanmarCabo VerdeCambodiaCameroonCanadaCaribbeanCentral AmericaChileChinaColombiaCongoCosta RicaCroatiaCubaCzechoslovakiaDenmarkDominicaDominican RepublicEastern AfricaEastern AsiaEastern EuropeEcuadorEgyptEl SalvadorEnglandEritreaEthiopiaEuropeFijiFranceGermanyGhanaGreeceGrenadaGuatemalaGuyanaHaitiHondurasHong KongHungaryIndiaIndonesiaIranIraqIrelandIsraelItalyJamaicaJapanJordanKazakhstanKenyaKoreaKuwaitLaosLatin AmericaLatviaLebanonLiberiaLithuaniaMalaysiaMexicoMicronesiaMiddle AfricaMoldovaMoroccoNepalNetherlandsNicaraguaNigeriaNorth AmericaNorth MacedoniaNorthern AfricaNorthern EuropeNorwayOceaniaPakistanPanamaPeruPhilippinesPolandPortugalRomaniaRussiaSaudi ArabiaScotlandSenegalSerbiaSierra LeoneSingaporeSomaliaSouth AfricaSouth AmericaSouth Central AsiaSouth Eastern AsiaSouthern EuropeSpainSri LankaSt. Vincent and the GrenadinesSudanSwedenSwitzerlandSyriaTaiwanThailandTrinidad and TobagoTurkeyUgandaUkraineUruguayUzbekistanVenezuelaVietnamWest IndiesWestern AfricaWestern AsiaWestern EuropeYemenZaireZimbabweAzores
Unemployment Among Ages 65 to 74 years
Income
Poverty
Unemployment
Labor Participation
Family Structure
Vehicle Availability
Education Level
Disability

Unemployment Among Ages 65 to 74 years Comparison

Hungarians

Poles

Tragic
Good
5.5%
UNEMPLOYMENT AMONG AGES 65 TO 74 YEARS
4.4/ 100
METRIC RATING
223rd/ 347
METRIC RANK
5.3%
UNEMPLOYMENT AMONG AGES 65 TO 74 YEARS
72.4/ 100
METRIC RATING
154th/ 347
METRIC RANK

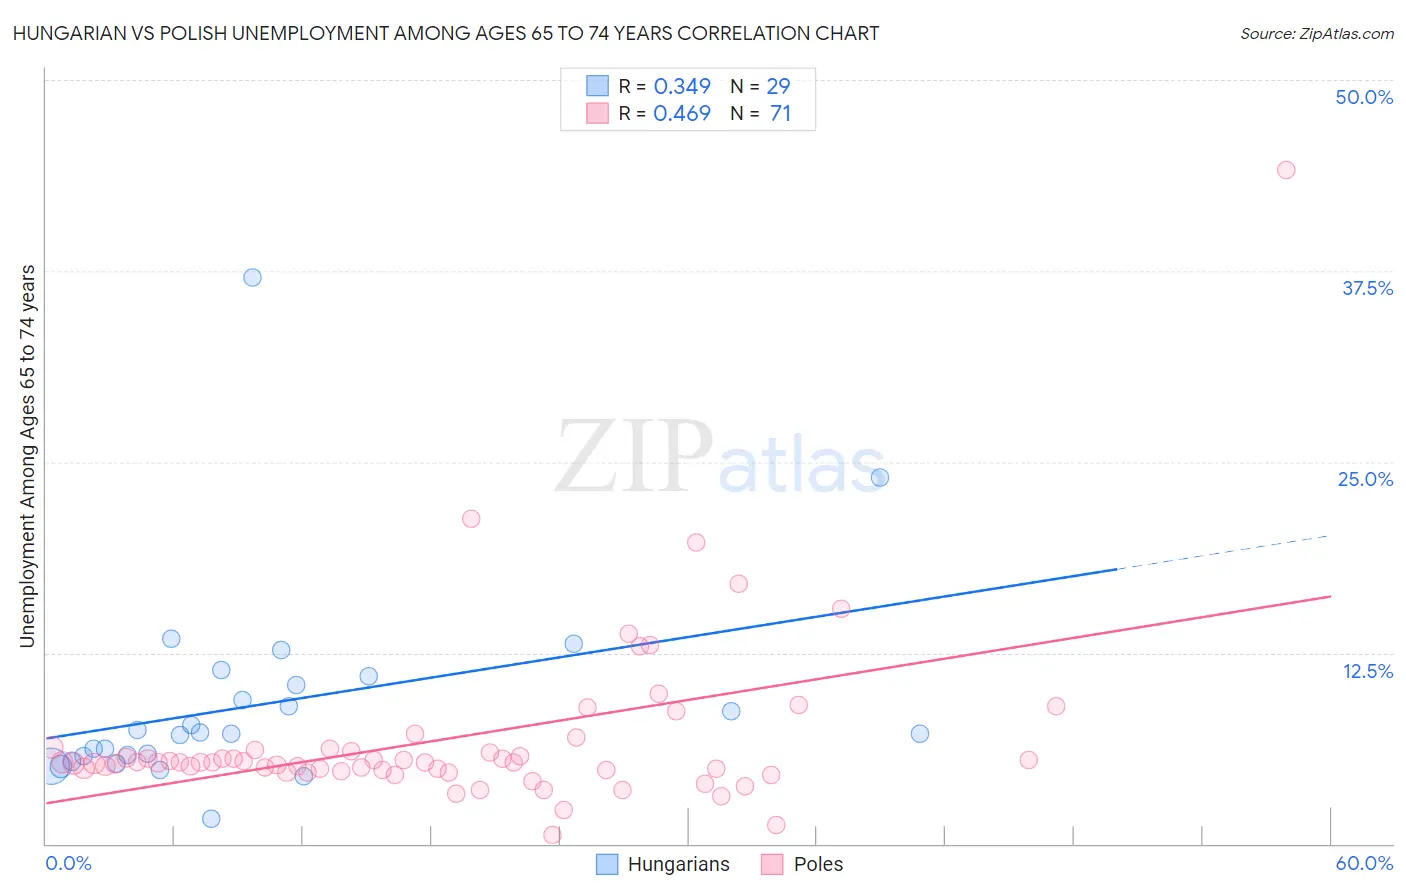
Hungarian vs Polish Unemployment Among Ages 65 to 74 years Correlation Chart

The statistical analysis conducted on geographies consisting of 405,744,527 people shows a mild positive correlation between the proportion of Hungarians and unemployment rate among population between the ages 65 and 74 in the United States with a correlation coefficient (R) of 0.349 and weighted average of 5.5%. Similarly, the statistical analysis conducted on geographies consisting of 441,300,890 people shows a moderate positive correlation between the proportion of Poles and unemployment rate among population between the ages 65 and 74 in the United States with a correlation coefficient (R) of 0.469 and weighted average of 5.3%, a difference of 3.4%.
Hungarian vs Polish Unemployment Among Ages 65 to 74 years

Unemployment Among Ages 65 to 74 years Correlation Summary

MeasurementHungarianPolish
Minimum1.7%0.60%
Maximum37.0%44.1%
Range35.4%43.5%
Mean9.2%6.9%
Median7.2%5.3%
Interquartile 25% (IQ1)5.6%4.8%
Interquartile 75% (IQ3)10.7%6.1%
Interquartile Range (IQR)5.1%1.3%
Standard Deviation (Sample)6.8%5.8%
Standard Deviation (Population)6.7%5.8%

Similar Demographics by Unemployment Among Ages 65 to 74 years

Demographics Similar to Hungarians by Unemployment Among Ages 65 to 74 years

In terms of unemployment among ages 65 to 74 years, the demographic groups most similar to Hungarians are Apache (5.5%, a difference of 0.010%), Immigrants from Uruguay (5.5%, a difference of 0.050%), Spaniard (5.5%, a difference of 0.060%), Immigrants from Trinidad and Tobago (5.5%, a difference of 0.060%), and Immigrants from Syria (5.5%, a difference of 0.11%).
DemographicsRating | RankUnemployment Among Ages 65 to 74 years
Uruguayans
6.2
/100
|
#216
Tragic
5.5%
Blackfeet
5.8
/100
|
#217
Tragic
5.5%
Samoans
5.7
/100
|
#218
Tragic
5.5%
Alsatians
5.6
/100
|
#219
Tragic
5.5%
Immigrants | Syria
5.1
/100
|
#220
Tragic
5.5%
Spaniards
4.8
/100
|
#221
Tragic
5.5%
Apache
4.5
/100
|
#222
Tragic
5.5%
Hungarians
4.4
/100
|
#223
Tragic
5.5%
Immigrants | Uruguay
4.2
/100
|
#224
Tragic
5.5%
Immigrants | Trinidad and Tobago
4.1
/100
|
#225
Tragic
5.5%
Hondurans
3.7
/100
|
#226
Tragic
5.5%
Immigrants | Albania
3.7
/100
|
#227
Tragic
5.5%
Immigrants | Israel
3.0
/100
|
#228
Tragic
5.5%
West Indians
2.7
/100
|
#229
Tragic
5.5%
Immigrants | Caribbean
2.7
/100
|
#230
Tragic
5.5%

Demographics Similar to Poles by Unemployment Among Ages 65 to 74 years

In terms of unemployment among ages 65 to 74 years, the demographic groups most similar to Poles are Immigrants from Cabo Verde (5.3%, a difference of 0.0%), Spanish (5.3%, a difference of 0.010%), Immigrants from Cameroon (5.3%, a difference of 0.010%), Immigrants from Indonesia (5.3%, a difference of 0.020%), and Dutch (5.3%, a difference of 0.020%).
DemographicsRating | RankUnemployment Among Ages 65 to 74 years
Immigrants | Latvia
74.6
/100
|
#147
Good
5.3%
Immigrants | Sri Lanka
73.8
/100
|
#148
Good
5.3%
Immigrants | Romania
73.5
/100
|
#149
Good
5.3%
Immigrants | Poland
73.2
/100
|
#150
Good
5.3%
Immigrants | Indonesia
72.9
/100
|
#151
Good
5.3%
Spanish
72.6
/100
|
#152
Good
5.3%
Immigrants | Cabo Verde
72.5
/100
|
#153
Good
5.3%
Poles
72.4
/100
|
#154
Good
5.3%
Immigrants | Cameroon
72.1
/100
|
#155
Good
5.3%
Dutch
72.0
/100
|
#156
Good
5.3%
Immigrants | Eastern Europe
71.5
/100
|
#157
Good
5.3%
Immigrants | France
71.0
/100
|
#158
Good
5.3%
Immigrants | Czechoslovakia
66.3
/100
|
#159
Good
5.3%
Bangladeshis
65.8
/100
|
#160
Good
5.3%
Immigrants | Italy
63.7
/100
|
#161
Good
5.3%