Hungarian vs Immigrants from Nepal Unemployment Among Seniors over 75 years

COMPARE

Hungarian
Race
Ancestry
AfghanAfricanAlaska NativeAlaskan AthabascanAlbanianAleutAlsatianAmericanApacheArabArapahoArgentineanArmenianAssyrian/Chaldean/SyriacAustralianAustrianBahamianBangladeshiBarbadianBasqueBelgianBelizeanBermudanBhutaneseBlackfeetBolivianBrazilianBritishBritish West IndianBulgarianBurmeseCajunCambodianCanadianCape VerdeanCarpatho RusynCelticCentral AmericanCentral American IndianCherokeeCheyenneChickasawChileanChineseChippewaChoctawColombianColvilleComancheCosta RicanCreeCreekCroatianCrowCubanCypriotCzechCzechoslovakianDanishDelawareDominicanDutchDutch West IndianEastern EuropeanEcuadorianEgyptianEnglishEstonianEthiopianEuropeanFijianFilipinoFinnishFrenchFrench American IndianFrench CanadianGermanGerman RussianGhanaianGreekGuamanian/ChamorroGuatemalanGuyaneseHaitianHmongHonduranHopiHoumaHungarianIcelanderIndian (Asian)IndonesianInupiatIranianIraqiIrishIroquoisIsraeliItalianJamaicanJapaneseJordanianKenyanKiowaKoreanLaotianLatvianLebaneseLiberianLithuanianLumbeeLuxembourgerMacedonianMalaysianMalteseMarshalleseMexicanMexican American IndianMongolianMoroccanNative HawaiianNavajoNepaleseNew ZealanderNicaraguanNigerianNorthern EuropeanNorwegianOkinawanOsageOttawaPaiutePakistaniPalestinianPanamanianParaguayanPennsylvania GermanPeruvianPimaPolishPortuguesePotawatomiPuebloPuerto RicanPuget Sound SalishRomanianRussianSalvadoranSamoanScandinavianScotch-IrishScottishSeminoleSenegaleseSerbianShoshoneSierra LeoneanSiouxSlavicSlovakSloveneSomaliSouth AfricanSouth AmericanSouth American IndianSoviet UnionSpaniardSpanishSpanish AmericanSpanish American IndianSri LankanSubsaharan AfricanSudaneseSwedishSwissSyrianTaiwaneseThaiTlingit-HaidaTohono O'OdhamTonganTrinidadian and TobagonianTsimshianTurkishU.S. Virgin IslanderUgandanUkrainianUruguayanUteVenezuelanVietnameseWelshWest IndianYakamaYaquiYugoslavianYumanYup'ikZimbabwean
Immigration
NonimmigrantsImmigrantsAfghanistanAfricaAlbaniaArgentinaArmeniaAsiaAustraliaAustriaBahamasBangladeshBarbadosBelarusBelgiumBelizeBoliviaBosnia and HerzegovinaBrazilBulgariaBurma/MyanmarCabo VerdeCambodiaCameroonCanadaCaribbeanCentral AmericaChileChinaColombiaCongoCosta RicaCroatiaCubaCzechoslovakiaDenmarkDominicaDominican RepublicEastern AfricaEastern AsiaEastern EuropeEcuadorEgyptEl SalvadorEnglandEritreaEthiopiaEuropeFijiFranceGermanyGhanaGreeceGrenadaGuatemalaGuyanaHaitiHondurasHong KongHungaryIndiaIndonesiaIranIraqIrelandIsraelItalyJamaicaJapanJordanKazakhstanKenyaKoreaKuwaitLaosLatin AmericaLatviaLebanonLiberiaLithuaniaMalaysiaMexicoMicronesiaMiddle AfricaMoldovaMoroccoNetherlandsNicaraguaNigeriaNorth AmericaNorth MacedoniaNorthern AfricaNorthern EuropeNorwayOceaniaPakistanPanamaPeruPhilippinesPolandPortugalRomaniaRussiaSaudi ArabiaScotlandSenegalSerbiaSierra LeoneSingaporeSomaliaSouth AfricaSouth AmericaSouth Central AsiaSouth Eastern AsiaSouthern EuropeSpainSri LankaSt. Vincent and the GrenadinesSudanSwedenSwitzerlandSyriaTaiwanThailandTrinidad and TobagoTurkeyUgandaUkraineUruguayUzbekistanVenezuelaVietnamWest IndiesWestern AfricaWestern AsiaWestern EuropeYemenZaireZimbabweAzores
Immigrants from Nepal
Race
Ancestry
AfghanAfricanAlaska NativeAlaskan AthabascanAlbanianAleutAlsatianAmericanApacheArabArapahoArgentineanArmenianAssyrian/Chaldean/SyriacAustralianAustrianBahamianBangladeshiBarbadianBasqueBelgianBelizeanBermudanBhutaneseBlackfeetBolivianBrazilianBritishBritish West IndianBulgarianBurmeseCajunCambodianCanadianCape VerdeanCarpatho RusynCelticCentral AmericanCentral American IndianCherokeeCheyenneChickasawChileanChineseChippewaChoctawColombianColvilleComancheCosta RicanCreeCreekCroatianCrowCubanCypriotCzechCzechoslovakianDanishDelawareDominicanDutchDutch West IndianEastern EuropeanEcuadorianEgyptianEnglishEstonianEthiopianEuropeanFijianFilipinoFinnishFrenchFrench American IndianFrench CanadianGermanGerman RussianGhanaianGreekGuamanian/ChamorroGuatemalanGuyaneseHaitianHmongHonduranHopiHoumaIcelanderIndian (Asian)IndonesianInupiatIranianIraqiIrishIroquoisIsraeliItalianJamaicanJapaneseJordanianKenyanKiowaKoreanLaotianLatvianLebaneseLiberianLithuanianLumbeeLuxembourgerMacedonianMalaysianMalteseMarshalleseMexicanMexican American IndianMongolianMoroccanNative HawaiianNavajoNepaleseNew ZealanderNicaraguanNigerianNorthern EuropeanNorwegianOkinawanOsageOttawaPaiutePakistaniPalestinianPanamanianParaguayanPennsylvania GermanPeruvianPimaPolishPortuguesePotawatomiPuebloPuerto RicanPuget Sound SalishRomanianRussianSalvadoranSamoanScandinavianScotch-IrishScottishSeminoleSenegaleseSerbianShoshoneSierra LeoneanSiouxSlavicSlovakSloveneSomaliSouth AfricanSouth AmericanSouth American IndianSoviet UnionSpaniardSpanishSpanish AmericanSpanish American IndianSri LankanSubsaharan AfricanSudaneseSwedishSwissSyrianTaiwaneseThaiTlingit-HaidaTohono O'OdhamTonganTrinidadian and TobagonianTsimshianTurkishU.S. Virgin IslanderUgandanUkrainianUruguayanUteVenezuelanVietnameseWelshWest IndianYakamaYaquiYugoslavianYumanYup'ikZimbabwean
Immigration
NonimmigrantsImmigrantsAfghanistanAfricaAlbaniaArgentinaArmeniaAsiaAustraliaAustriaBahamasBangladeshBarbadosBelarusBelgiumBelizeBoliviaBosnia and HerzegovinaBrazilBulgariaBurma/MyanmarCabo VerdeCambodiaCameroonCanadaCaribbeanCentral AmericaChileChinaColombiaCongoCosta RicaCroatiaCubaCzechoslovakiaDenmarkDominicaDominican RepublicEastern AfricaEastern AsiaEastern EuropeEcuadorEgyptEl SalvadorEnglandEritreaEthiopiaEuropeFijiFranceGermanyGhanaGreeceGrenadaGuatemalaGuyanaHaitiHondurasHong KongHungaryIndiaIndonesiaIranIraqIrelandIsraelItalyJamaicaJapanJordanKazakhstanKenyaKoreaKuwaitLaosLatin AmericaLatviaLebanonLiberiaLithuaniaMalaysiaMexicoMicronesiaMiddle AfricaMoldovaMoroccoNepalNetherlandsNicaraguaNigeriaNorth AmericaNorth MacedoniaNorthern AfricaNorthern EuropeNorwayOceaniaPakistanPanamaPeruPhilippinesPolandPortugalRomaniaRussiaSaudi ArabiaScotlandSenegalSerbiaSierra LeoneSingaporeSomaliaSouth AfricaSouth AmericaSouth Central AsiaSouth Eastern AsiaSouthern EuropeSpainSri LankaSt. Vincent and the GrenadinesSudanSwedenSwitzerlandSyriaTaiwanThailandTrinidad and TobagoTurkeyUgandaUkraineUruguayUzbekistanVenezuelaVietnamWest IndiesWestern AfricaWestern AsiaWestern EuropeYemenZaireZimbabweAzores
Unemployment Among Seniors over 75 years
Income
Poverty
Unemployment
Labor Participation
Family Structure
Vehicle Availability
Education Level
Disability

Unemployment Among Seniors over 75 years Comparison

Hungarians

Immigrants from Nepal

Tragic
Exceptional
10.1%
UNEMPLOYMENT AMONG SENIORS OVER 75 YEARS
0.0/ 100
METRIC RATING
310th/ 347
METRIC RANK
8.3%
UNEMPLOYMENT AMONG SENIORS OVER 75 YEARS
96.9/ 100
METRIC RATING
123rd/ 347
METRIC RANK

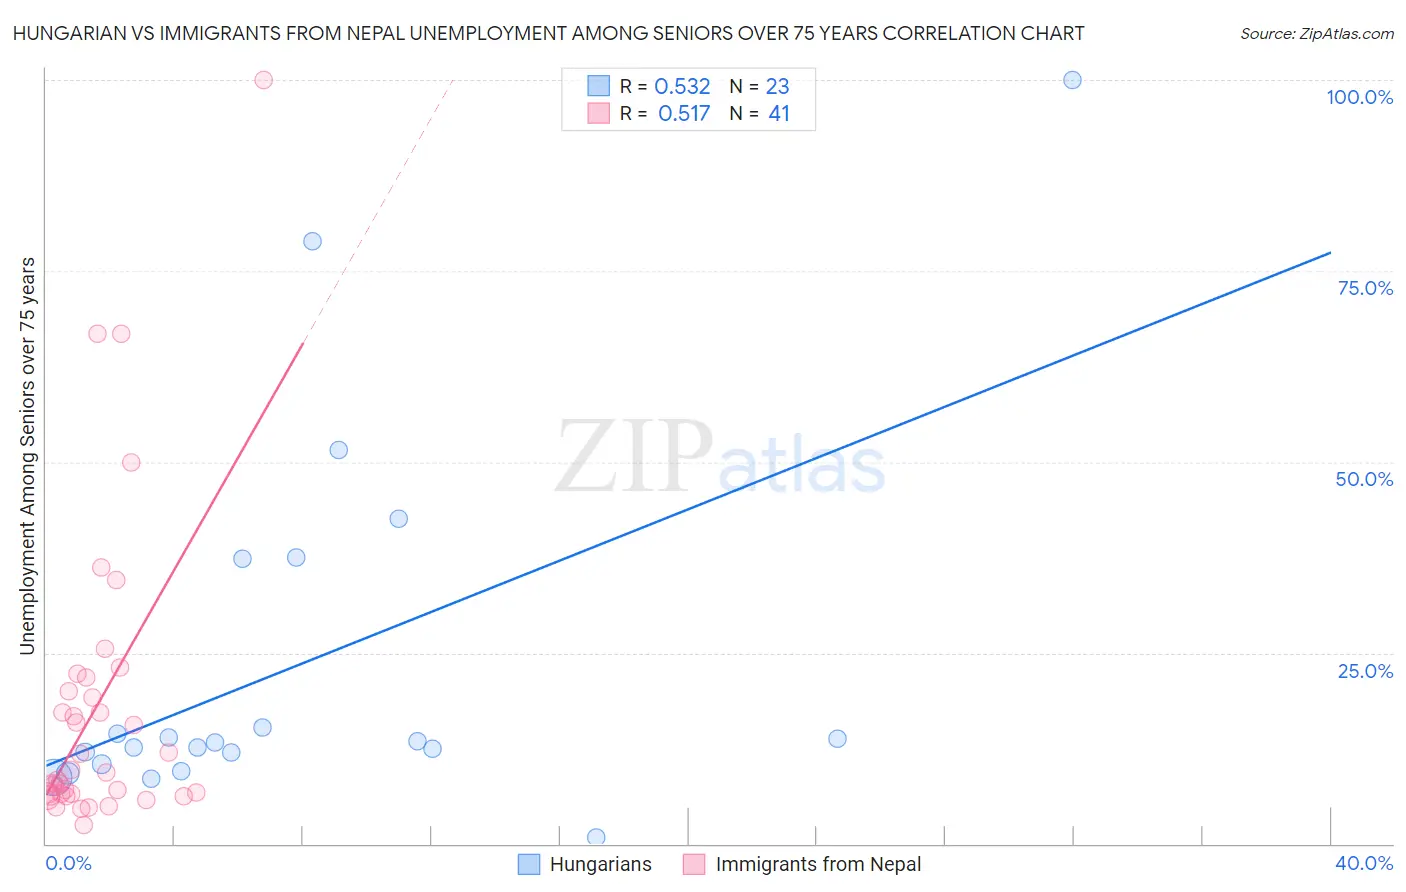
Hungarian vs Immigrants from Nepal Unemployment Among Seniors over 75 years Correlation Chart

The statistical analysis conducted on geographies consisting of 221,758,984 people shows a substantial positive correlation between the proportion of Hungarians and unemployment rate among seniors over the age of 75 in the United States with a correlation coefficient (R) of 0.532 and weighted average of 10.1%. Similarly, the statistical analysis conducted on geographies consisting of 118,449,831 people shows a substantial positive correlation between the proportion of Immigrants from Nepal and unemployment rate among seniors over the age of 75 in the United States with a correlation coefficient (R) of 0.517 and weighted average of 8.3%, a difference of 20.9%.
Hungarian vs Immigrants from Nepal Unemployment Among Seniors over 75 years

Unemployment Among Seniors over 75 years Correlation Summary

MeasurementHungarianImmigrants from Nepal
Minimum0.90%2.4%
Maximum100.0%100.0%
Range99.1%97.6%
Mean23.5%18.0%
Median13.2%9.3%
Interquartile 25% (IQ1)10.4%6.5%
Interquartile 75% (IQ3)37.3%20.9%
Interquartile Range (IQR)26.9%14.4%
Standard Deviation (Sample)24.5%20.2%
Standard Deviation (Population)23.9%19.9%

Similar Demographics by Unemployment Among Seniors over 75 years

Demographics Similar to Hungarians by Unemployment Among Seniors over 75 years

In terms of unemployment among seniors over 75 years, the demographic groups most similar to Hungarians are Scottish (10.1%, a difference of 0.11%), Chippewa (10.1%, a difference of 0.13%), English (10.1%, a difference of 0.19%), White/Caucasian (10.1%, a difference of 0.25%), and Nepalese (10.1%, a difference of 0.25%).
DemographicsRating | RankUnemployment Among Seniors over 75 years
Puget Sound Salish
0.0
/100
|
#303
Tragic
10.0%
Scotch-Irish
0.0
/100
|
#304
Tragic
10.0%
Swedes
0.0
/100
|
#305
Tragic
10.0%
Italians
0.0
/100
|
#306
Tragic
10.0%
Immigrants | Fiji
0.0
/100
|
#307
Tragic
10.0%
Whites/Caucasians
0.0
/100
|
#308
Tragic
10.1%
English
0.0
/100
|
#309
Tragic
10.1%
Hungarians
0.0
/100
|
#310
Tragic
10.1%
Scottish
0.0
/100
|
#311
Tragic
10.1%
Chippewa
0.0
/100
|
#312
Tragic
10.1%
Nepalese
0.0
/100
|
#313
Tragic
10.1%
Dutch West Indians
0.0
/100
|
#314
Tragic
10.2%
Pennsylvania Germans
0.0
/100
|
#315
Tragic
10.2%
Natives/Alaskans
0.0
/100
|
#316
Tragic
10.2%
Irish
0.0
/100
|
#317
Tragic
10.2%

Demographics Similar to Immigrants from Nepal by Unemployment Among Seniors over 75 years

In terms of unemployment among seniors over 75 years, the demographic groups most similar to Immigrants from Nepal are Thai (8.3%, a difference of 0.040%), Immigrants from Moldova (8.3%, a difference of 0.060%), Immigrants from Russia (8.3%, a difference of 0.080%), Immigrants from Croatia (8.3%, a difference of 0.15%), and Immigrants from Asia (8.3%, a difference of 0.27%).
DemographicsRating | RankUnemployment Among Seniors over 75 years
Immigrants | West Indies
98.1
/100
|
#116
Exceptional
8.3%
Immigrants | Greece
97.9
/100
|
#117
Exceptional
8.3%
Immigrants | Middle Africa
97.9
/100
|
#118
Exceptional
8.3%
Japanese
97.5
/100
|
#119
Exceptional
8.3%
Immigrants | Asia
97.4
/100
|
#120
Exceptional
8.3%
Immigrants | Croatia
97.2
/100
|
#121
Exceptional
8.3%
Immigrants | Russia
97.1
/100
|
#122
Exceptional
8.3%
Immigrants | Nepal
96.9
/100
|
#123
Exceptional
8.3%
Thais
96.8
/100
|
#124
Exceptional
8.3%
Immigrants | Moldova
96.7
/100
|
#125
Exceptional
8.3%
Belizeans
96.3
/100
|
#126
Exceptional
8.4%
Hondurans
96.2
/100
|
#127
Exceptional
8.4%
Native Hawaiians
96.1
/100
|
#128
Exceptional
8.4%
Ghanaians
96.0
/100
|
#129
Exceptional
8.4%
Apache
95.2
/100
|
#130
Exceptional
8.4%