Hungarian vs Afghan Unemployment Among Ages 35 to 44 years
COMPARE
Hungarian
Afghan
Unemployment Among Ages 35 to 44 years
Unemployment Among Ages 35 to 44 years Comparison
Hungarians
Afghans
4.6%
UNEMPLOYMENT AMONG AGES 35 TO 44 YEARS
62.6/ 100
METRIC RATING
160th/ 347
METRIC RANK
4.7%
UNEMPLOYMENT AMONG AGES 35 TO 44 YEARS
50.0/ 100
METRIC RATING
174th/ 347
METRIC RANK
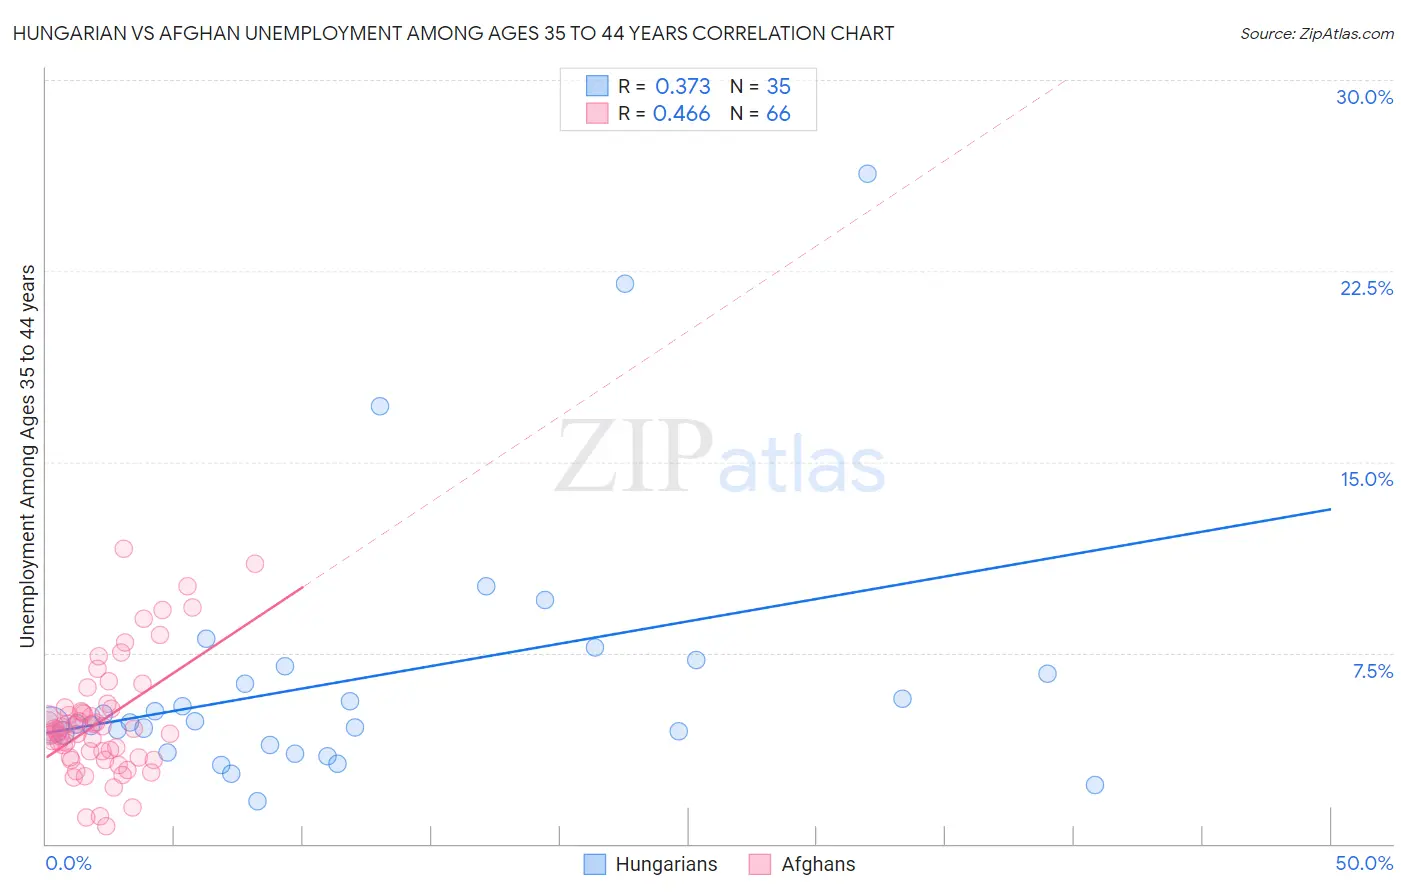
Hungarian vs Afghan Unemployment Among Ages 35 to 44 years Correlation Chart
The statistical analysis conducted on geographies consisting of 465,604,082 people shows a mild positive correlation between the proportion of Hungarians and unemployment rate among population between the ages 35 and 44 in the United States with a correlation coefficient (R) of 0.373 and weighted average of 4.6%. Similarly, the statistical analysis conducted on geographies consisting of 148,051,072 people shows a moderate positive correlation between the proportion of Afghans and unemployment rate among population between the ages 35 and 44 in the United States with a correlation coefficient (R) of 0.466 and weighted average of 4.7%, a difference of 0.92%.
Unemployment Among Ages 35 to 44 years Correlation Summary
| Measurement | Hungarian | Afghan |
| Minimum | 1.7% | 0.70% |
| Maximum | 26.3% | 11.6% |
| Range | 24.6% | 10.9% |
| Mean | 6.5% | 4.8% |
| Median | 4.7% | 4.5% |
| Interquartile 25% (IQ1) | 3.9% | 3.4% |
| Interquartile 75% (IQ3) | 7.0% | 5.3% |
| Interquartile Range (IQR) | 3.1% | 1.9% |
| Standard Deviation (Sample) | 5.2% | 2.2% |
| Standard Deviation (Population) | 5.1% | 2.2% |
Demographics Similar to Hungarians and Afghans by Unemployment Among Ages 35 to 44 years
In terms of unemployment among ages 35 to 44 years, the demographic groups most similar to Hungarians are Albanian (4.6%, a difference of 0.030%), Immigrants from Iran (4.6%, a difference of 0.040%), Immigrants from Belarus (4.6%, a difference of 0.070%), Celtic (4.7%, a difference of 0.070%), and Costa Rican (4.7%, a difference of 0.22%). Similarly, the demographic groups most similar to Afghans are Iraqi (4.7%, a difference of 0.060%), Immigrants from Germany (4.7%, a difference of 0.080%), Lebanese (4.7%, a difference of 0.10%), Indonesian (4.7%, a difference of 0.12%), and Immigrants from Uganda (4.7%, a difference of 0.14%).
| Demographics | Rating | Rank | Unemployment Among Ages 35 to 44 years |
| Immigrants | Belarus | 63.4 /100 | #157 | Good 4.6% |
| Immigrants | Iran | 63.1 /100 | #158 | Good 4.6% |
| Albanians | 63.0 /100 | #159 | Good 4.6% |
| Hungarians | 62.6 /100 | #160 | Good 4.6% |
| Celtics | 61.7 /100 | #161 | Good 4.7% |
| Costa Ricans | 59.6 /100 | #162 | Average 4.7% |
| South Africans | 58.5 /100 | #163 | Average 4.7% |
| Immigrants | Morocco | 57.2 /100 | #164 | Average 4.7% |
| German Russians | 57.2 /100 | #165 | Average 4.7% |
| French | 55.6 /100 | #166 | Average 4.7% |
| Peruvians | 54.4 /100 | #167 | Average 4.7% |
| Arabs | 53.1 /100 | #168 | Average 4.7% |
| Pennsylvania Germans | 53.0 /100 | #169 | Average 4.7% |
| Immigrants | Indonesia | 52.6 /100 | #170 | Average 4.7% |
| Indonesians | 51.7 /100 | #171 | Average 4.7% |
| Lebanese | 51.4 /100 | #172 | Average 4.7% |
| Iraqis | 50.9 /100 | #173 | Average 4.7% |
| Afghans | 50.0 /100 | #174 | Average 4.7% |
| Immigrants | Germany | 48.9 /100 | #175 | Average 4.7% |
| Immigrants | Uganda | 48.1 /100 | #176 | Average 4.7% |
| Slovaks | 44.6 /100 | #177 | Average 4.7% |