Houma vs Immigrants from St. Vincent and the Grenadines Unemployment Among Ages 25 to 29 years
COMPARE
Houma
Immigrants from St. Vincent and the Grenadines
Unemployment Among Ages 25 to 29 years
Unemployment Among Ages 25 to 29 years Comparison
Houma
Immigrants from St. Vincent and the Grenadines
8.7%
UNEMPLOYMENT AMONG AGES 25 TO 29 YEARS
0.0/ 100
METRIC RATING
324th/ 347
METRIC RANK
8.4%
UNEMPLOYMENT AMONG AGES 25 TO 29 YEARS
0.0/ 100
METRIC RATING
313th/ 347
METRIC RANK
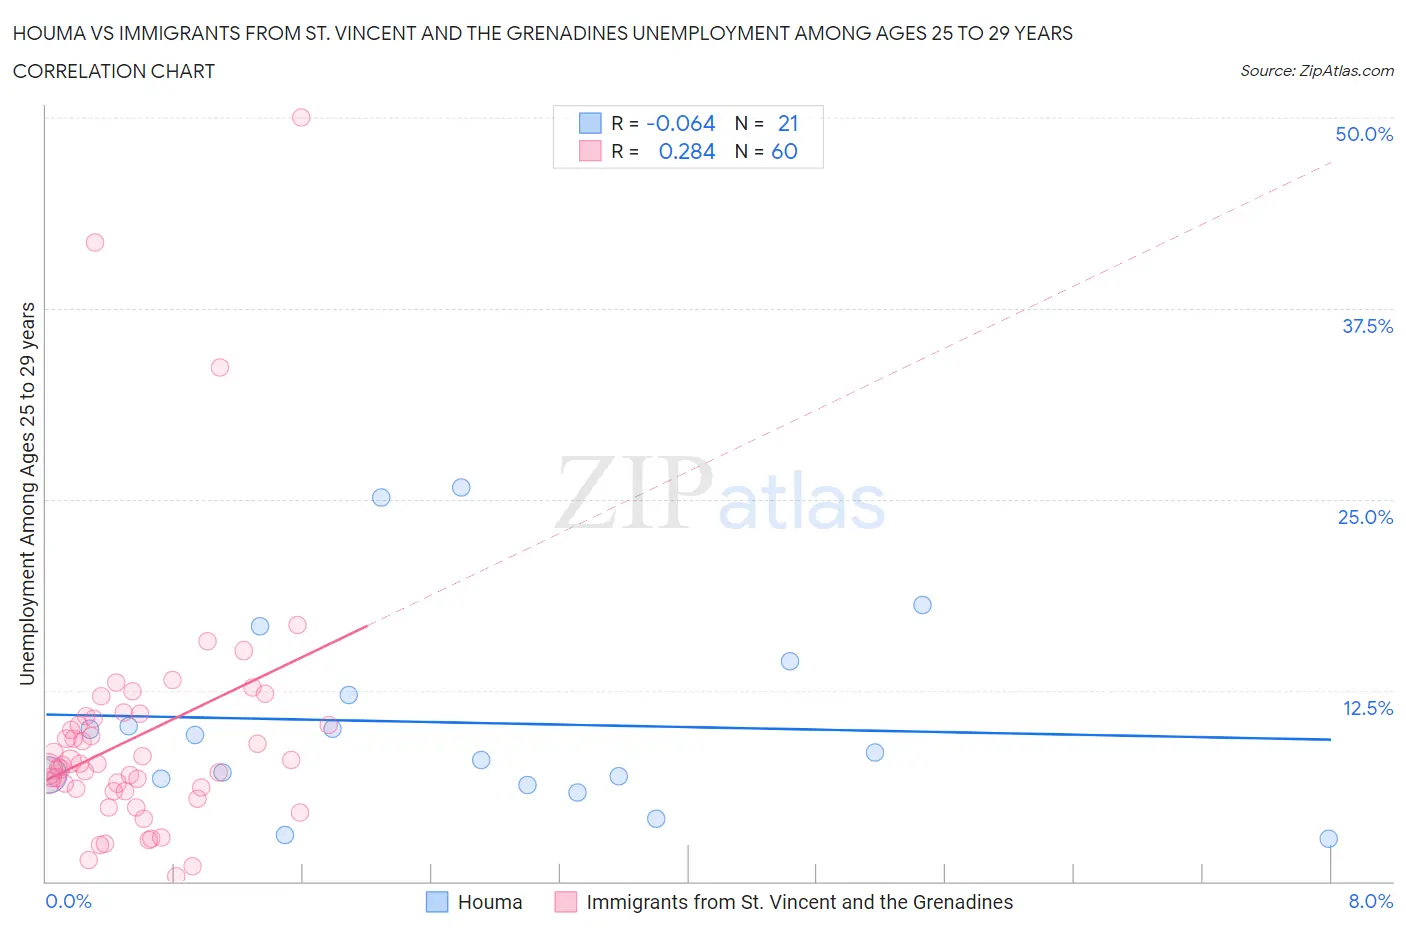
Houma vs Immigrants from St. Vincent and the Grenadines Unemployment Among Ages 25 to 29 years Correlation Chart
The statistical analysis conducted on geographies consisting of 36,263,529 people shows a slight negative correlation between the proportion of Houma and unemployment rate among population between the ages 25 and 29 in the United States with a correlation coefficient (R) of -0.064 and weighted average of 8.7%. Similarly, the statistical analysis conducted on geographies consisting of 55,669,457 people shows a weak positive correlation between the proportion of Immigrants from St. Vincent and the Grenadines and unemployment rate among population between the ages 25 and 29 in the United States with a correlation coefficient (R) of 0.284 and weighted average of 8.4%, a difference of 4.2%.
Unemployment Among Ages 25 to 29 years Correlation Summary
| Measurement | Houma | Immigrants from St. Vincent and the Grenadines |
| Minimum | 2.8% | 0.30% |
| Maximum | 25.8% | 50.0% |
| Range | 23.0% | 49.7% |
| Mean | 10.4% | 9.5% |
| Median | 8.5% | 7.7% |
| Interquartile 25% (IQ1) | 6.5% | 6.0% |
| Interquartile 75% (IQ3) | 13.3% | 10.7% |
| Interquartile Range (IQR) | 6.8% | 4.7% |
| Standard Deviation (Sample) | 6.4% | 8.4% |
| Standard Deviation (Population) | 6.3% | 8.3% |
Demographics Similar to Houma and Immigrants from St. Vincent and the Grenadines by Unemployment Among Ages 25 to 29 years
In terms of unemployment among ages 25 to 29 years, the demographic groups most similar to Houma are Dominican (8.7%, a difference of 0.36%), Tlingit-Haida (8.7%, a difference of 0.45%), Yakama (8.8%, a difference of 0.51%), Immigrants from Dominican Republic (8.6%, a difference of 1.2%), and Black/African American (8.6%, a difference of 1.9%). Similarly, the demographic groups most similar to Immigrants from St. Vincent and the Grenadines are Immigrants from Dominica (8.4%, a difference of 0.35%), British West Indian (8.4%, a difference of 0.94%), Immigrants from Grenada (8.4%, a difference of 1.0%), Immigrants from Guyana (8.5%, a difference of 1.1%), and Guyanese (8.5%, a difference of 1.4%).
| Demographics | Rating | Rank | Unemployment Among Ages 25 to 29 years |
| Immigrants | Jamaica | 0.0 /100 | #308 | Tragic 8.1% |
| Immigrants | Haiti | 0.0 /100 | #309 | Tragic 8.1% |
| U.S. Virgin Islanders | 0.0 /100 | #310 | Tragic 8.1% |
| Immigrants | Azores | 0.0 /100 | #311 | Tragic 8.1% |
| Dutch West Indians | 0.0 /100 | #312 | Tragic 8.2% |
| Immigrants | St. Vincent and the Grenadines | 0.0 /100 | #313 | Tragic 8.4% |
| Immigrants | Dominica | 0.0 /100 | #314 | Tragic 8.4% |
| British West Indians | 0.0 /100 | #315 | Tragic 8.4% |
| Immigrants | Grenada | 0.0 /100 | #316 | Tragic 8.4% |
| Immigrants | Guyana | 0.0 /100 | #317 | Tragic 8.5% |
| Guyanese | 0.0 /100 | #318 | Tragic 8.5% |
| Immigrants | Armenia | 0.0 /100 | #319 | Tragic 8.5% |
| Blacks/African Americans | 0.0 /100 | #320 | Tragic 8.6% |
| Immigrants | Dominican Republic | 0.0 /100 | #321 | Tragic 8.6% |
| Tlingit-Haida | 0.0 /100 | #322 | Tragic 8.7% |
| Dominicans | 0.0 /100 | #323 | Tragic 8.7% |
| Houma | 0.0 /100 | #324 | Tragic 8.7% |
| Yakama | 0.0 /100 | #325 | Tragic 8.8% |
| Shoshone | 0.0 /100 | #326 | Tragic 9.2% |
| Colville | 0.0 /100 | #327 | Tragic 9.2% |
| Apache | 0.0 /100 | #328 | Tragic 9.5% |