Hopi vs Immigrants from Nicaragua Unemployment Among Ages 45 to 54 years

COMPARE

Hopi
Race
Ancestry
AfghanAfricanAlaska NativeAlaskan AthabascanAlbanianAleutAlsatianAmericanApacheArabArapahoArgentineanArmenianAssyrian/Chaldean/SyriacAustralianAustrianBahamianBangladeshiBarbadianBasqueBelgianBelizeanBermudanBhutaneseBlackfeetBolivianBrazilianBritishBritish West IndianBulgarianBurmeseCajunCambodianCanadianCape VerdeanCarpatho RusynCelticCentral AmericanCentral American IndianCherokeeCheyenneChickasawChileanChineseChippewaChoctawColombianColvilleComancheCosta RicanCreeCreekCroatianCrowCubanCypriotCzechCzechoslovakianDanishDelawareDominicanDutchDutch West IndianEastern EuropeanEcuadorianEgyptianEnglishEstonianEthiopianEuropeanFijianFilipinoFinnishFrenchFrench American IndianFrench CanadianGermanGerman RussianGhanaianGreekGuamanian/ChamorroGuatemalanGuyaneseHaitianHmongHonduranHopiHoumaHungarianIcelanderIndian (Asian)IndonesianInupiatIranianIraqiIrishIroquoisIsraeliItalianJamaicanJapaneseJordanianKenyanKiowaKoreanLaotianLatvianLebaneseLiberianLithuanianLumbeeLuxembourgerMacedonianMalaysianMalteseMarshalleseMenomineeMexicanMexican American IndianMongolianMoroccanNative HawaiianNavajoNepaleseNew ZealanderNicaraguanNigerianNorthern EuropeanNorwegianOkinawanOsageOttawaPaiutePakistaniPalestinianPanamanianParaguayanPennsylvania GermanPeruvianPimaPolishPortuguesePotawatomiPuebloPuerto RicanPuget Sound SalishRomanianRussianSalvadoranSamoanScandinavianScotch-IrishScottishSeminoleSenegaleseSerbianShoshoneSierra LeoneanSiouxSlavicSlovakSloveneSomaliSouth AfricanSouth AmericanSouth American IndianSoviet UnionSpaniardSpanishSpanish AmericanSpanish American IndianSri LankanSubsaharan AfricanSudaneseSwedishSwissSyrianTaiwaneseThaiTlingit-HaidaTohono O'OdhamTonganTrinidadian and TobagonianTsimshianTurkishU.S. Virgin IslanderUgandanUkrainianUruguayanUteVenezuelanVietnameseWelshWest IndianYakamaYaquiYugoslavianYumanYup'ikZimbabwean
Immigration
NonimmigrantsImmigrantsAfghanistanAfricaAlbaniaArgentinaArmeniaAsiaAustraliaAustriaBahamasBangladeshBarbadosBelarusBelgiumBelizeBoliviaBosnia and HerzegovinaBrazilBulgariaBurma/MyanmarCabo VerdeCambodiaCameroonCanadaCaribbeanCentral AmericaChileChinaColombiaCongoCosta RicaCroatiaCubaCzechoslovakiaDenmarkDominicaDominican RepublicEastern AfricaEastern AsiaEastern EuropeEcuadorEgyptEl SalvadorEnglandEritreaEthiopiaEuropeFijiFranceGermanyGhanaGreeceGrenadaGuatemalaGuyanaHaitiHondurasHong KongHungaryIndiaIndonesiaIranIraqIrelandIsraelItalyJamaicaJapanJordanKazakhstanKenyaKoreaKuwaitLaosLatin AmericaLatviaLebanonLiberiaLithuaniaMalaysiaMexicoMicronesiaMiddle AfricaMoldovaMoroccoNepalNetherlandsNigeriaNorth AmericaNorth MacedoniaNorthern AfricaNorthern EuropeNorwayOceaniaPakistanPanamaPeruPhilippinesPolandPortugalRomaniaRussiaSaudi ArabiaScotlandSenegalSerbiaSierra LeoneSingaporeSomaliaSouth AfricaSouth AmericaSouth Central AsiaSouth Eastern AsiaSouthern EuropeSpainSri LankaSt. Vincent and the GrenadinesSudanSwedenSwitzerlandSyriaTaiwanThailandTrinidad and TobagoTurkeyUgandaUkraineUruguayUzbekistanVenezuelaVietnamWest IndiesWestern AfricaWestern AsiaWestern EuropeYemenZaireZimbabweAzores
Immigrants from Nicaragua
Race
Ancestry
AfghanAfricanAlaska NativeAlaskan AthabascanAlbanianAleutAlsatianAmericanApacheArabArapahoArgentineanArmenianAssyrian/Chaldean/SyriacAustralianAustrianBahamianBangladeshiBarbadianBasqueBelgianBelizeanBermudanBhutaneseBlackfeetBolivianBrazilianBritishBritish West IndianBulgarianBurmeseCajunCambodianCanadianCape VerdeanCarpatho RusynCelticCentral AmericanCentral American IndianCherokeeCheyenneChickasawChileanChineseChippewaChoctawColombianColvilleComancheCosta RicanCreeCreekCroatianCrowCubanCypriotCzechCzechoslovakianDanishDelawareDominicanDutchDutch West IndianEastern EuropeanEcuadorianEgyptianEnglishEstonianEthiopianEuropeanFijianFilipinoFinnishFrenchFrench American IndianFrench CanadianGermanGerman RussianGhanaianGreekGuamanian/ChamorroGuatemalanGuyaneseHaitianHmongHonduranHoumaHungarianIcelanderIndian (Asian)IndonesianInupiatIranianIraqiIrishIroquoisIsraeliItalianJamaicanJapaneseJordanianKenyanKiowaKoreanLaotianLatvianLebaneseLiberianLithuanianLumbeeLuxembourgerMacedonianMalaysianMalteseMarshalleseMenomineeMexicanMexican American IndianMongolianMoroccanNative HawaiianNavajoNepaleseNew ZealanderNicaraguanNigerianNorthern EuropeanNorwegianOkinawanOsageOttawaPaiutePakistaniPalestinianPanamanianParaguayanPennsylvania GermanPeruvianPimaPolishPortuguesePotawatomiPuebloPuerto RicanPuget Sound SalishRomanianRussianSalvadoranSamoanScandinavianScotch-IrishScottishSeminoleSenegaleseSerbianShoshoneSierra LeoneanSiouxSlavicSlovakSloveneSomaliSouth AfricanSouth AmericanSouth American IndianSoviet UnionSpaniardSpanishSpanish AmericanSpanish American IndianSri LankanSubsaharan AfricanSudaneseSwedishSwissSyrianTaiwaneseThaiTlingit-HaidaTohono O'OdhamTonganTrinidadian and TobagonianTsimshianTurkishU.S. Virgin IslanderUgandanUkrainianUruguayanUteVenezuelanVietnameseWelshWest IndianYakamaYaquiYugoslavianYumanYup'ikZimbabwean
Immigration
NonimmigrantsImmigrantsAfghanistanAfricaAlbaniaArgentinaArmeniaAsiaAustraliaAustriaBahamasBangladeshBarbadosBelarusBelgiumBelizeBoliviaBosnia and HerzegovinaBrazilBulgariaBurma/MyanmarCabo VerdeCambodiaCameroonCanadaCaribbeanCentral AmericaChileChinaColombiaCongoCosta RicaCroatiaCubaCzechoslovakiaDenmarkDominicaDominican RepublicEastern AfricaEastern AsiaEastern EuropeEcuadorEgyptEl SalvadorEnglandEritreaEthiopiaEuropeFijiFranceGermanyGhanaGreeceGrenadaGuatemalaGuyanaHaitiHondurasHong KongHungaryIndiaIndonesiaIranIraqIrelandIsraelItalyJamaicaJapanJordanKazakhstanKenyaKoreaKuwaitLaosLatin AmericaLatviaLebanonLiberiaLithuaniaMalaysiaMexicoMicronesiaMiddle AfricaMoldovaMoroccoNepalNetherlandsNicaraguaNigeriaNorth AmericaNorth MacedoniaNorthern AfricaNorthern EuropeNorwayOceaniaPakistanPanamaPeruPhilippinesPolandPortugalRomaniaRussiaSaudi ArabiaScotlandSenegalSerbiaSierra LeoneSingaporeSomaliaSouth AfricaSouth AmericaSouth Central AsiaSouth Eastern AsiaSouthern EuropeSpainSri LankaSt. Vincent and the GrenadinesSudanSwedenSwitzerlandSyriaTaiwanThailandTrinidad and TobagoTurkeyUgandaUkraineUruguayUzbekistanVenezuelaVietnamWest IndiesWestern AfricaWestern AsiaWestern EuropeYemenZaireZimbabweAzores
Unemployment Among Ages 45 to 54 years
Income
Poverty
Unemployment
Labor Participation
Family Structure
Vehicle Availability
Education Level
Disability

Unemployment Among Ages 45 to 54 years Comparison

Hopi

Immigrants from Nicaragua

Tragic
Exceptional
7.5%
UNEMPLOYMENT AMONG AGES 45 TO 54 YEARS
0.0/ 100
METRIC RATING
340th/ 347
METRIC RANK
4.4%
UNEMPLOYMENT AMONG AGES 45 TO 54 YEARS
91.3/ 100
METRIC RATING
111th/ 347
METRIC RANK

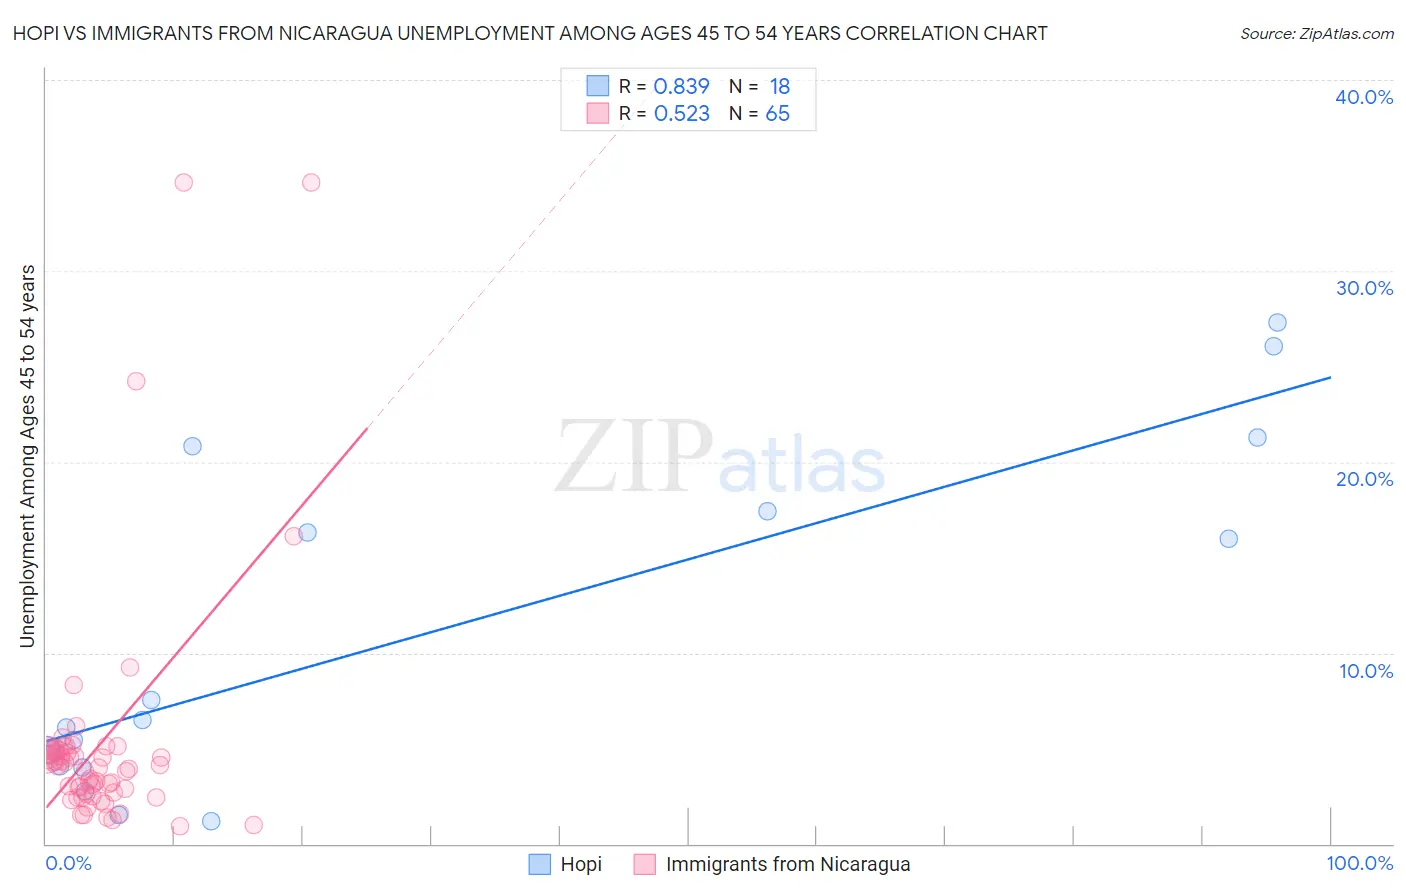
Hopi vs Immigrants from Nicaragua Unemployment Among Ages 45 to 54 years Correlation Chart

The statistical analysis conducted on geographies consisting of 74,415,108 people shows a very strong positive correlation between the proportion of Hopi and unemployment rate among population between the ages 45 and 54 in the United States with a correlation coefficient (R) of 0.839 and weighted average of 7.5%. Similarly, the statistical analysis conducted on geographies consisting of 233,935,488 people shows a substantial positive correlation between the proportion of Immigrants from Nicaragua and unemployment rate among population between the ages 45 and 54 in the United States with a correlation coefficient (R) of 0.523 and weighted average of 4.4%, a difference of 71.0%.
Hopi vs Immigrants from Nicaragua Unemployment Among Ages 45 to 54 years

Unemployment Among Ages 45 to 54 years Correlation Summary

MeasurementHopiImmigrants from Nicaragua
Minimum1.2%0.90%
Maximum27.3%34.6%
Range26.1%33.7%
Mean10.8%5.2%
Median6.3%4.1%
Interquartile 25% (IQ1)4.0%2.7%
Interquartile 75% (IQ3)17.4%4.8%
Interquartile Range (IQR)13.4%2.2%
Standard Deviation (Sample)8.7%6.2%
Standard Deviation (Population)8.5%6.2%

Similar Demographics by Unemployment Among Ages 45 to 54 years

Demographics Similar to Hopi by Unemployment Among Ages 45 to 54 years

In terms of unemployment among ages 45 to 54 years, the demographic groups most similar to Hopi are Arapaho (7.5%, a difference of 0.46%), Colville (7.4%, a difference of 1.9%), Paiute (7.8%, a difference of 3.5%), Apache (7.0%, a difference of 7.0%), and Puerto Rican (6.8%, a difference of 10.6%).
DemographicsRating | RankUnemployment Among Ages 45 to 54 years
Immigrants | Yemen
0.0
/100
|
#333
Tragic
6.5%
Sioux
0.0
/100
|
#334
Tragic
6.6%
Navajo
0.0
/100
|
#335
Tragic
6.7%
Puerto Ricans
0.0
/100
|
#336
Tragic
6.8%
Apache
0.0
/100
|
#337
Tragic
7.0%
Colville
0.0
/100
|
#338
Tragic
7.4%
Arapaho
0.0
/100
|
#339
Tragic
7.5%
Hopi
0.0
/100
|
#340
Tragic
7.5%
Paiute
0.0
/100
|
#341
Tragic
7.8%
Alaskan Athabascans
0.0
/100
|
#342
Tragic
8.5%
Inupiat
0.0
/100
|
#343
Tragic
9.2%
Yuman
0.0
/100
|
#344
Tragic
9.5%
Cheyenne
0.0
/100
|
#345
Tragic
10.6%
Yup'ik
0.0
/100
|
#346
Tragic
11.9%
Crow
0.0
/100
|
#347
Tragic
13.7%

Demographics Similar to Immigrants from Nicaragua by Unemployment Among Ages 45 to 54 years

In terms of unemployment among ages 45 to 54 years, the demographic groups most similar to Immigrants from Nicaragua are Immigrants from England (4.4%, a difference of 0.010%), Immigrants from Saudi Arabia (4.4%, a difference of 0.030%), French Canadian (4.4%, a difference of 0.040%), Immigrants from Chile (4.4%, a difference of 0.060%), and Pakistani (4.4%, a difference of 0.080%).
DemographicsRating | RankUnemployment Among Ages 45 to 54 years
Immigrants | Sweden
93.0
/100
|
#104
Exceptional
4.4%
Immigrants | Kenya
92.8
/100
|
#105
Exceptional
4.4%
Iranians
92.5
/100
|
#106
Exceptional
4.4%
Immigrants | South Africa
92.5
/100
|
#107
Exceptional
4.4%
Russians
92.1
/100
|
#108
Exceptional
4.4%
New Zealanders
91.9
/100
|
#109
Exceptional
4.4%
Immigrants | England
91.3
/100
|
#110
Exceptional
4.4%
Immigrants | Nicaragua
91.3
/100
|
#111
Exceptional
4.4%
Immigrants | Saudi Arabia
91.1
/100
|
#112
Exceptional
4.4%
French Canadians
91.0
/100
|
#113
Exceptional
4.4%
Immigrants | Chile
90.9
/100
|
#114
Exceptional
4.4%
Pakistanis
90.7
/100
|
#115
Exceptional
4.4%
Immigrants | North Macedonia
90.6
/100
|
#116
Exceptional
4.4%
South Africans
90.4
/100
|
#117
Exceptional
4.4%
Immigrants | Romania
90.0
/100
|
#118
Exceptional
4.4%