Hmong vs Polish Unemployment Among Seniors over 75 years
COMPARE
Hmong
Polish
Unemployment Among Seniors over 75 years
Unemployment Among Seniors over 75 years Comparison
Hmong
Poles
13.7%
UNEMPLOYMENT AMONG SENIORS OVER 75 YEARS
0.0/ 100
METRIC RATING
342nd/ 347
METRIC RANK
10.3%
UNEMPLOYMENT AMONG SENIORS OVER 75 YEARS
0.0/ 100
METRIC RATING
322nd/ 347
METRIC RANK
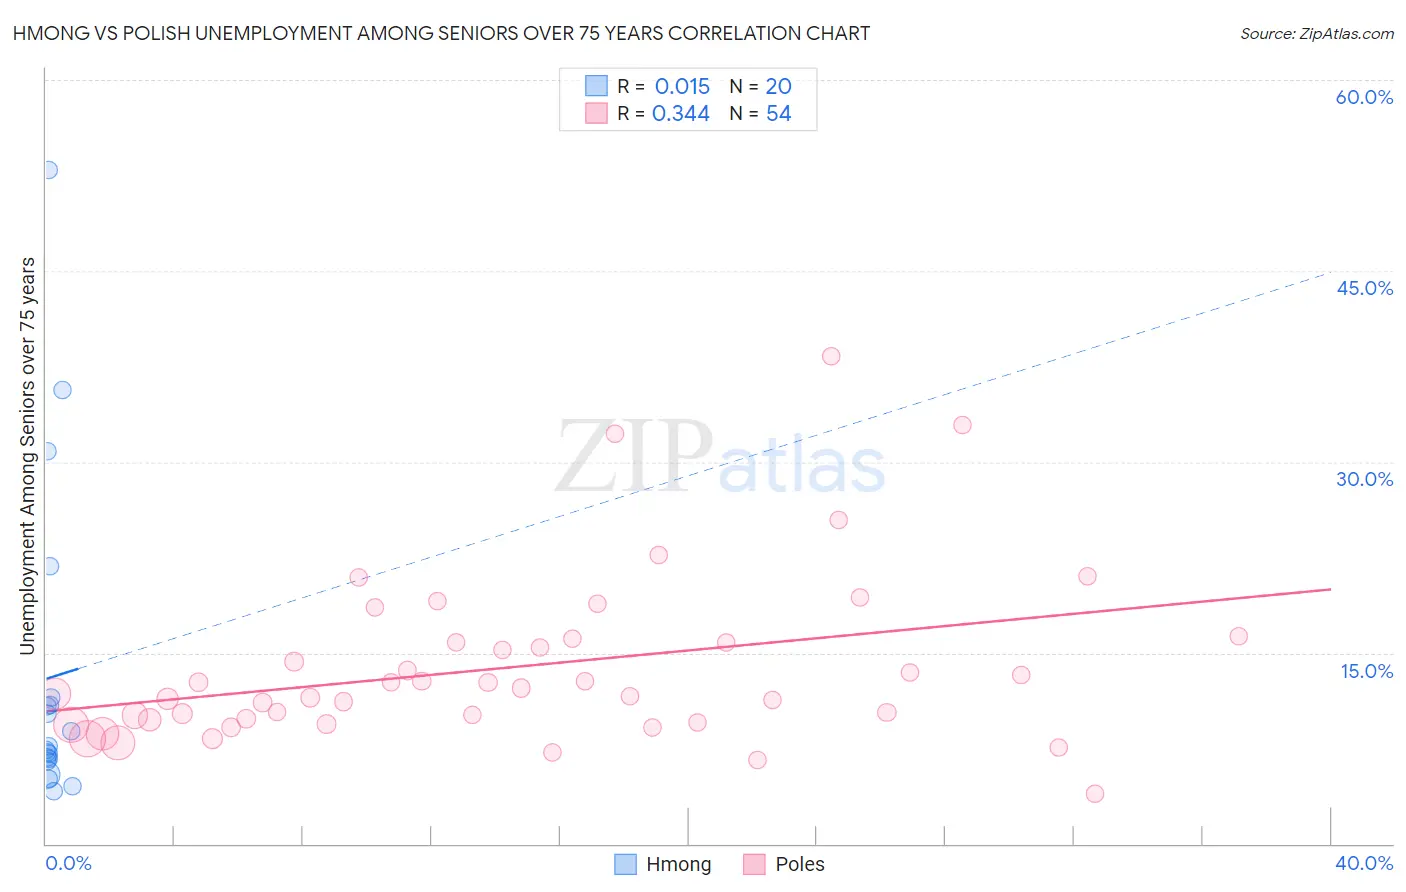
Hmong vs Polish Unemployment Among Seniors over 75 years Correlation Chart
The statistical analysis conducted on geographies consisting of 23,120,726 people shows no correlation between the proportion of Hmong and unemployment rate among seniors over the age of 75 in the United States with a correlation coefficient (R) of 0.015 and weighted average of 13.7%. Similarly, the statistical analysis conducted on geographies consisting of 233,225,718 people shows a mild positive correlation between the proportion of Poles and unemployment rate among seniors over the age of 75 in the United States with a correlation coefficient (R) of 0.344 and weighted average of 10.3%, a difference of 33.1%.
Unemployment Among Seniors over 75 years Correlation Summary
| Measurement | Hmong | Polish |
| Minimum | 4.1% | 3.9% |
| Maximum | 52.9% | 38.3% |
| Range | 48.8% | 34.4% |
| Mean | 13.1% | 13.9% |
| Median | 7.5% | 12.0% |
| Interquartile 25% (IQ1) | 6.6% | 9.7% |
| Interquartile 75% (IQ3) | 11.2% | 15.9% |
| Interquartile Range (IQR) | 4.6% | 6.1% |
| Standard Deviation (Sample) | 12.7% | 6.7% |
| Standard Deviation (Population) | 12.4% | 6.6% |
Demographics Similar to Hmong and Poles by Unemployment Among Seniors over 75 years
In terms of unemployment among seniors over 75 years, the demographic groups most similar to Hmong are Lumbee (13.5%, a difference of 2.0%), Yup'ik (12.8%, a difference of 7.6%), Cajun (12.5%, a difference of 10.0%), Immigrants from Cabo Verde (12.3%, a difference of 11.4%), and Cape Verdean (11.4%, a difference of 20.3%). Similarly, the demographic groups most similar to Poles are Tongan (10.4%, a difference of 0.64%), American (10.4%, a difference of 0.67%), Portuguese (10.4%, a difference of 0.87%), Slovak (10.4%, a difference of 1.1%), and Dutch (10.4%, a difference of 1.2%).
| Demographics | Rating | Rank | Unemployment Among Seniors over 75 years |
| Poles | 0.0 /100 | #322 | Tragic 10.3% |
| Tongans | 0.0 /100 | #323 | Tragic 10.4% |
| Americans | 0.0 /100 | #324 | Tragic 10.4% |
| Portuguese | 0.0 /100 | #325 | Tragic 10.4% |
| Slovaks | 0.0 /100 | #326 | Tragic 10.4% |
| Dutch | 0.0 /100 | #327 | Tragic 10.4% |
| Immigrants | Portugal | 0.0 /100 | #328 | Tragic 10.5% |
| Tsimshian | 0.0 /100 | #329 | Tragic 10.5% |
| Immigrants | Azores | 0.0 /100 | #330 | Tragic 10.7% |
| Tohono O'odham | 0.0 /100 | #331 | Tragic 10.8% |
| Immigrants | Liberia | 0.0 /100 | #332 | Tragic 10.9% |
| Alaskan Athabascans | 0.0 /100 | #333 | Tragic 11.0% |
| Assyrians/Chaldeans/Syriacs | 0.0 /100 | #334 | Tragic 11.1% |
| French Canadians | 0.0 /100 | #335 | Tragic 11.2% |
| Immigrants | North Macedonia | 0.0 /100 | #336 | Tragic 11.3% |
| Cape Verdeans | 0.0 /100 | #337 | Tragic 11.4% |
| Immigrants | Cabo Verde | 0.0 /100 | #338 | Tragic 12.3% |
| Cajuns | 0.0 /100 | #339 | Tragic 12.5% |
| Yup'ik | 0.0 /100 | #340 | Tragic 12.8% |
| Lumbee | 0.0 /100 | #341 | Tragic 13.5% |
| Hmong | 0.0 /100 | #342 | Tragic 13.7% |