Hmong vs Immigrants from Japan Unemployment Among Seniors over 65 years

COMPARE

Hmong
Race
Ancestry
AfghanAfricanAlaska NativeAlaskan AthabascanAlbanianAleutAlsatianAmericanApacheArabArapahoArgentineanArmenianAssyrian/Chaldean/SyriacAustralianAustrianBahamianBangladeshiBarbadianBasqueBelgianBelizeanBermudanBhutaneseBlackfeetBolivianBrazilianBritishBritish West IndianBulgarianBurmeseCajunCambodianCanadianCape VerdeanCarpatho RusynCelticCentral AmericanCentral American IndianCherokeeCheyenneChickasawChileanChineseChippewaChoctawColombianColvilleComancheCosta RicanCreeCreekCroatianCrowCubanCypriotCzechCzechoslovakianDanishDelawareDominicanDutchDutch West IndianEastern EuropeanEcuadorianEgyptianEnglishEstonianEthiopianEuropeanFijianFilipinoFinnishFrenchFrench American IndianFrench CanadianGermanGerman RussianGhanaianGreekGuamanian/ChamorroGuatemalanGuyaneseHaitianHmongHonduranHopiHoumaHungarianIcelanderIndian (Asian)IndonesianInupiatIranianIraqiIrishIroquoisIsraeliItalianJamaicanJapaneseJordanianKenyanKiowaKoreanLaotianLatvianLebaneseLiberianLithuanianLumbeeLuxembourgerMacedonianMalaysianMalteseMarshalleseMenomineeMexicanMexican American IndianMongolianMoroccanNative HawaiianNavajoNepaleseNew ZealanderNicaraguanNigerianNorthern EuropeanNorwegianOkinawanOsageOttawaPaiutePakistaniPalestinianPanamanianParaguayanPennsylvania GermanPeruvianPimaPolishPortuguesePotawatomiPuebloPuerto RicanPuget Sound SalishRomanianRussianSalvadoranSamoanScandinavianScotch-IrishScottishSeminoleSenegaleseSerbianShoshoneSierra LeoneanSiouxSlavicSlovakSloveneSomaliSouth AfricanSouth AmericanSouth American IndianSoviet UnionSpaniardSpanishSpanish AmericanSpanish American IndianSri LankanSubsaharan AfricanSudaneseSwedishSwissSyrianTaiwaneseThaiTlingit-HaidaTohono O'OdhamTonganTrinidadian and TobagonianTsimshianTurkishU.S. Virgin IslanderUgandanUkrainianUruguayanUteVenezuelanVietnameseWelshWest IndianYakamaYaquiYugoslavianYumanYup'ikZimbabwean
Immigration
NonimmigrantsImmigrantsAfghanistanAfricaAlbaniaArgentinaArmeniaAsiaAustraliaAustriaBahamasBangladeshBarbadosBelarusBelgiumBelizeBoliviaBosnia and HerzegovinaBrazilBulgariaBurma/MyanmarCabo VerdeCambodiaCameroonCanadaCaribbeanCentral AmericaChileChinaColombiaCongoCosta RicaCroatiaCubaCzechoslovakiaDenmarkDominicaDominican RepublicEastern AfricaEastern AsiaEastern EuropeEcuadorEgyptEl SalvadorEnglandEritreaEthiopiaEuropeFijiFranceGermanyGhanaGreeceGrenadaGuatemalaGuyanaHaitiHondurasHong KongHungaryIndiaIndonesiaIranIraqIrelandIsraelItalyJamaicaJordanKazakhstanKenyaKoreaKuwaitLaosLatin AmericaLatviaLebanonLiberiaLithuaniaMalaysiaMexicoMicronesiaMiddle AfricaMoldovaMoroccoNepalNetherlandsNicaraguaNigeriaNorth AmericaNorth MacedoniaNorthern AfricaNorthern EuropeNorwayOceaniaPakistanPanamaPeruPhilippinesPolandPortugalRomaniaRussiaSaudi ArabiaScotlandSenegalSerbiaSierra LeoneSingaporeSomaliaSouth AfricaSouth AmericaSouth Central AsiaSouth Eastern AsiaSouthern EuropeSpainSri LankaSt. Vincent and the GrenadinesSudanSwedenSwitzerlandSyriaTaiwanThailandTrinidad and TobagoTurkeyUgandaUkraineUruguayUzbekistanVenezuelaVietnamWest IndiesWestern AfricaWestern AsiaWestern EuropeYemenZaireZimbabweAzores
Immigrants from Japan
Race
Ancestry
AfghanAfricanAlaska NativeAlaskan AthabascanAlbanianAleutAlsatianAmericanApacheArabArapahoArgentineanArmenianAssyrian/Chaldean/SyriacAustralianAustrianBahamianBangladeshiBarbadianBasqueBelgianBelizeanBermudanBhutaneseBlackfeetBolivianBrazilianBritishBritish West IndianBulgarianBurmeseCajunCambodianCanadianCape VerdeanCarpatho RusynCelticCentral AmericanCentral American IndianCherokeeCheyenneChickasawChileanChineseChippewaChoctawColombianColvilleComancheCosta RicanCreeCreekCroatianCrowCubanCypriotCzechCzechoslovakianDanishDelawareDominicanDutchDutch West IndianEastern EuropeanEcuadorianEgyptianEnglishEstonianEthiopianEuropeanFijianFilipinoFinnishFrenchFrench American IndianFrench CanadianGermanGerman RussianGhanaianGreekGuamanian/ChamorroGuatemalanGuyaneseHaitianHonduranHopiHoumaHungarianIcelanderIndian (Asian)IndonesianInupiatIranianIraqiIrishIroquoisIsraeliItalianJamaicanJapaneseJordanianKenyanKiowaKoreanLaotianLatvianLebaneseLiberianLithuanianLumbeeLuxembourgerMacedonianMalaysianMalteseMarshalleseMenomineeMexicanMexican American IndianMongolianMoroccanNative HawaiianNavajoNepaleseNew ZealanderNicaraguanNigerianNorthern EuropeanNorwegianOkinawanOsageOttawaPaiutePakistaniPalestinianPanamanianParaguayanPennsylvania GermanPeruvianPimaPolishPortuguesePotawatomiPuebloPuerto RicanPuget Sound SalishRomanianRussianSalvadoranSamoanScandinavianScotch-IrishScottishSeminoleSenegaleseSerbianShoshoneSierra LeoneanSiouxSlavicSlovakSloveneSomaliSouth AfricanSouth AmericanSouth American IndianSoviet UnionSpaniardSpanishSpanish AmericanSpanish American IndianSri LankanSubsaharan AfricanSudaneseSwedishSwissSyrianTaiwaneseThaiTlingit-HaidaTohono O'OdhamTonganTrinidadian and TobagonianTsimshianTurkishU.S. Virgin IslanderUgandanUkrainianUruguayanUteVenezuelanVietnameseWelshWest IndianYakamaYaquiYugoslavianYumanYup'ikZimbabwean
Immigration
NonimmigrantsImmigrantsAfghanistanAfricaAlbaniaArgentinaArmeniaAsiaAustraliaAustriaBahamasBangladeshBarbadosBelarusBelgiumBelizeBoliviaBosnia and HerzegovinaBrazilBulgariaBurma/MyanmarCabo VerdeCambodiaCameroonCanadaCaribbeanCentral AmericaChileChinaColombiaCongoCosta RicaCroatiaCubaCzechoslovakiaDenmarkDominicaDominican RepublicEastern AfricaEastern AsiaEastern EuropeEcuadorEgyptEl SalvadorEnglandEritreaEthiopiaEuropeFijiFranceGermanyGhanaGreeceGrenadaGuatemalaGuyanaHaitiHondurasHong KongHungaryIndiaIndonesiaIranIraqIrelandIsraelItalyJamaicaJapanJordanKazakhstanKenyaKoreaKuwaitLaosLatin AmericaLatviaLebanonLiberiaLithuaniaMalaysiaMexicoMicronesiaMiddle AfricaMoldovaMoroccoNepalNetherlandsNicaraguaNigeriaNorth AmericaNorth MacedoniaNorthern AfricaNorthern EuropeNorwayOceaniaPakistanPanamaPeruPhilippinesPolandPortugalRomaniaRussiaSaudi ArabiaScotlandSenegalSerbiaSierra LeoneSingaporeSomaliaSouth AfricaSouth AmericaSouth Central AsiaSouth Eastern AsiaSouthern EuropeSpainSri LankaSt. Vincent and the GrenadinesSudanSwedenSwitzerlandSyriaTaiwanThailandTrinidad and TobagoTurkeyUgandaUkraineUruguayUzbekistanVenezuelaVietnamWest IndiesWestern AfricaWestern AsiaWestern EuropeYemenZaireZimbabweAzores
Unemployment Among Seniors over 65 years
Income
Poverty
Unemployment
Labor Participation
Family Structure
Vehicle Availability
Education Level
Disability

Unemployment Among Seniors over 65 years Comparison

Hmong

Immigrants from Japan

Exceptional
Exceptional
4.2%
UNEMPLOYMENT AMONG SENIORS OVER 65 YEARS
100.0/ 100
METRIC RATING
2nd/ 347
METRIC RANK
4.9%
UNEMPLOYMENT AMONG SENIORS OVER 65 YEARS
99.2/ 100
METRIC RATING
73rd/ 347
METRIC RANK

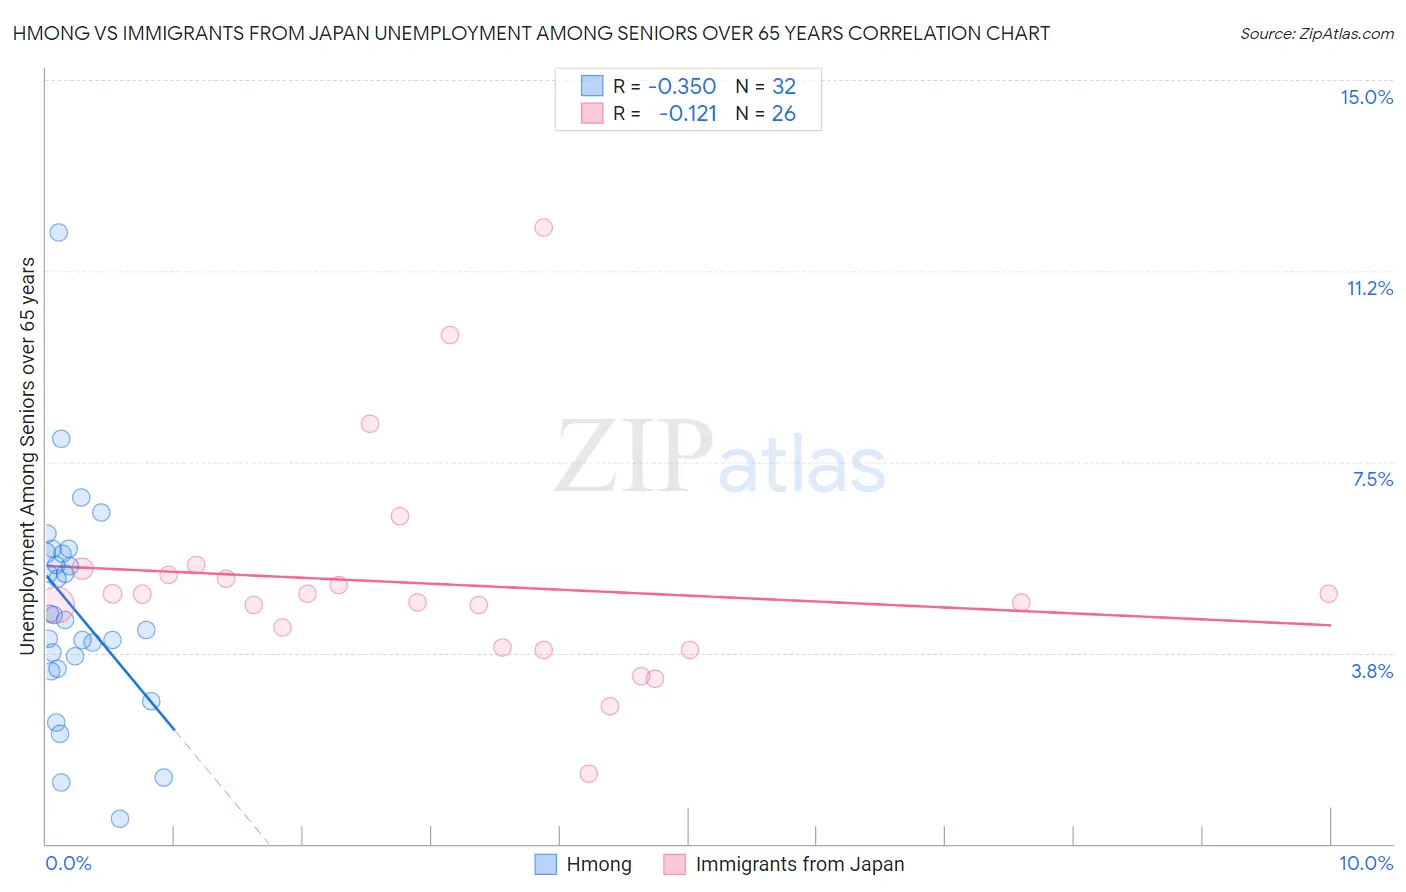
Hmong vs Immigrants from Japan Unemployment Among Seniors over 65 years Correlation Chart

The statistical analysis conducted on geographies consisting of 24,334,539 people shows a mild negative correlation between the proportion of Hmong and unemployment rate amomg seniors over the age of 65 in the United States with a correlation coefficient (R) of -0.350 and weighted average of 4.2%. Similarly, the statistical analysis conducted on geographies consisting of 312,855,333 people shows a poor negative correlation between the proportion of Immigrants from Japan and unemployment rate amomg seniors over the age of 65 in the United States with a correlation coefficient (R) of -0.121 and weighted average of 4.9%, a difference of 16.8%.
Hmong vs Immigrants from Japan Unemployment Among Seniors over 65 years

Unemployment Among Seniors over 65 years Correlation Summary

MeasurementHmongImmigrants from Japan
Minimum0.50%1.4%
Maximum12.0%12.1%
Range11.5%10.7%
Mean4.6%5.1%
Median4.5%4.8%
Interquartile 25% (IQ1)3.6%3.9%
Interquartile 75% (IQ3)5.7%5.3%
Interquartile Range (IQR)2.2%1.4%
Standard Deviation (Sample)2.2%2.2%
Standard Deviation (Population)2.1%2.1%

Similar Demographics by Unemployment Among Seniors over 65 years

Demographics Similar to Hmong by Unemployment Among Seniors over 65 years

In terms of unemployment among seniors over 65 years, the demographic groups most similar to Hmong are Fijian (4.2%, a difference of 0.28%), Chinese (4.2%, a difference of 0.91%), Sudanese (4.4%, a difference of 4.0%), Chickasaw (4.4%, a difference of 4.1%), and Immigrants from Cuba (4.5%, a difference of 5.4%).
DemographicsRating | RankUnemployment Among Seniors over 65 years
Chinese
100.0
/100
|
#1
Exceptional
4.2%
Hmong
100.0
/100
|
#2
Exceptional
4.2%
Fijians
100.0
/100
|
#3
Exceptional
4.2%
Sudanese
100.0
/100
|
#4
Exceptional
4.4%
Chickasaw
100.0
/100
|
#5
Exceptional
4.4%
Immigrants | Cuba
100.0
/100
|
#6
Exceptional
4.5%
Immigrants | Congo
100.0
/100
|
#7
Exceptional
4.5%
Tsimshian
100.0
/100
|
#8
Exceptional
4.5%
Indonesians
100.0
/100
|
#9
Exceptional
4.5%
Immigrants | Zaire
100.0
/100
|
#10
Exceptional
4.5%
Comanche
100.0
/100
|
#11
Exceptional
4.6%
Osage
100.0
/100
|
#12
Exceptional
4.6%
Cubans
100.0
/100
|
#13
Exceptional
4.6%
Menominee
100.0
/100
|
#14
Exceptional
4.6%
Lumbee
100.0
/100
|
#15
Exceptional
4.6%

Demographics Similar to Immigrants from Japan by Unemployment Among Seniors over 65 years

In terms of unemployment among seniors over 65 years, the demographic groups most similar to Immigrants from Japan are Japanese (4.9%, a difference of 0.030%), Nicaraguan (4.9%, a difference of 0.080%), British (4.9%, a difference of 0.11%), Welsh (5.0%, a difference of 0.15%), and Thai (5.0%, a difference of 0.16%).
DemographicsRating | RankUnemployment Among Seniors over 65 years
English
99.5
/100
|
#66
Exceptional
4.9%
Iroquois
99.5
/100
|
#67
Exceptional
4.9%
Bolivians
99.5
/100
|
#68
Exceptional
4.9%
Scottish
99.5
/100
|
#69
Exceptional
4.9%
Immigrants | Kazakhstan
99.4
/100
|
#70
Exceptional
4.9%
Immigrants | Moldova
99.4
/100
|
#71
Exceptional
4.9%
Nicaraguans
99.3
/100
|
#72
Exceptional
4.9%
Immigrants | Japan
99.2
/100
|
#73
Exceptional
4.9%
Japanese
99.2
/100
|
#74
Exceptional
4.9%
British
99.1
/100
|
#75
Exceptional
4.9%
Welsh
99.1
/100
|
#76
Exceptional
5.0%
Thais
99.1
/100
|
#77
Exceptional
5.0%
Slavs
98.9
/100
|
#78
Exceptional
5.0%
Immigrants | Netherlands
98.8
/100
|
#79
Exceptional
5.0%
Immigrants | Ethiopia
98.6
/100
|
#80
Exceptional
5.0%