Hmong vs Immigrants from Cabo Verde Unemployment Among Ages 20 to 24 years
COMPARE
Hmong
Immigrants from Cabo Verde
Unemployment Among Ages 20 to 24 years
Unemployment Among Ages 20 to 24 years Comparison
Hmong
Immigrants from Cabo Verde
9.4%
UNEMPLOYMENT AMONG AGES 20 TO 24 YEARS
100.0/ 100
METRIC RATING
19th/ 347
METRIC RANK
12.2%
UNEMPLOYMENT AMONG AGES 20 TO 24 YEARS
0.0/ 100
METRIC RATING
302nd/ 347
METRIC RANK
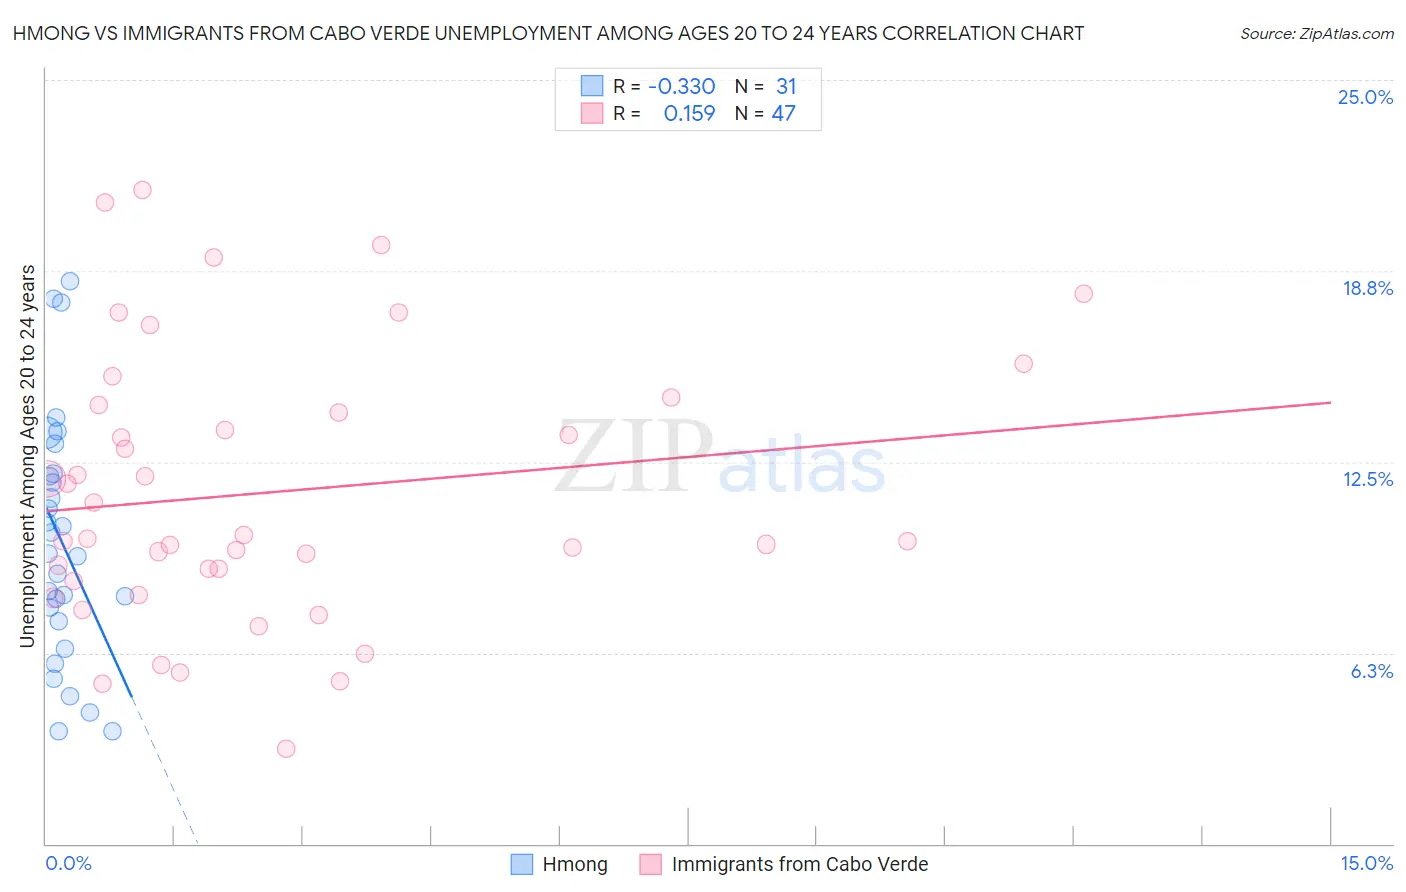
Hmong vs Immigrants from Cabo Verde Unemployment Among Ages 20 to 24 years Correlation Chart
The statistical analysis conducted on geographies consisting of 24,629,146 people shows a mild negative correlation between the proportion of Hmong and unemployment rate among population between the ages 20 and 24 in the United States with a correlation coefficient (R) of -0.330 and weighted average of 9.4%. Similarly, the statistical analysis conducted on geographies consisting of 37,888,752 people shows a poor positive correlation between the proportion of Immigrants from Cabo Verde and unemployment rate among population between the ages 20 and 24 in the United States with a correlation coefficient (R) of 0.159 and weighted average of 12.2%, a difference of 30.2%.
Unemployment Among Ages 20 to 24 years Correlation Summary
| Measurement | Hmong | Immigrants from Cabo Verde |
| Minimum | 3.7% | 3.1% |
| Maximum | 18.4% | 21.4% |
| Range | 14.7% | 18.3% |
| Mean | 9.9% | 11.5% |
| Median | 9.5% | 10.0% |
| Interquartile 25% (IQ1) | 7.3% | 8.6% |
| Interquartile 75% (IQ3) | 12.1% | 14.4% |
| Interquartile Range (IQR) | 4.8% | 5.8% |
| Standard Deviation (Sample) | 4.0% | 4.4% |
| Standard Deviation (Population) | 3.9% | 4.4% |
Similar Demographics by Unemployment Among Ages 20 to 24 years
Demographics Similar to Hmong by Unemployment Among Ages 20 to 24 years
In terms of unemployment among ages 20 to 24 years, the demographic groups most similar to Hmong are Osage (9.4%, a difference of 0.010%), Immigrants from Bosnia and Herzegovina (9.4%, a difference of 0.010%), Chinese (9.4%, a difference of 0.12%), Tongan (9.4%, a difference of 0.28%), and Immigrants from Nepal (9.4%, a difference of 0.29%).
| Demographics | Rating | Rank | Unemployment Among Ages 20 to 24 years |
| Cubans | 100.0 /100 | #12 | Exceptional 9.2% |
| Immigrants | Congo | 100.0 /100 | #13 | Exceptional 9.2% |
| Slovenes | 100.0 /100 | #14 | Exceptional 9.3% |
| Immigrants | Sudan | 100.0 /100 | #15 | Exceptional 9.3% |
| Danes | 100.0 /100 | #16 | Exceptional 9.3% |
| Czechs | 100.0 /100 | #17 | Exceptional 9.3% |
| Chinese | 100.0 /100 | #18 | Exceptional 9.4% |
| Hmong | 100.0 /100 | #19 | Exceptional 9.4% |
| Osage | 100.0 /100 | #20 | Exceptional 9.4% |
| Immigrants | Bosnia and Herzegovina | 100.0 /100 | #21 | Exceptional 9.4% |
| Tongans | 100.0 /100 | #22 | Exceptional 9.4% |
| Immigrants | Nepal | 100.0 /100 | #23 | Exceptional 9.4% |
| Taiwanese | 100.0 /100 | #24 | Exceptional 9.4% |
| Immigrants | Eritrea | 100.0 /100 | #25 | Exceptional 9.5% |
| Swedes | 100.0 /100 | #26 | Exceptional 9.5% |
Demographics Similar to Immigrants from Cabo Verde by Unemployment Among Ages 20 to 24 years
In terms of unemployment among ages 20 to 24 years, the demographic groups most similar to Immigrants from Cabo Verde are Haitian (12.2%, a difference of 0.020%), Immigrants from West Indies (12.3%, a difference of 0.61%), Chippewa (12.3%, a difference of 0.65%), Immigrants from Sierra Leone (12.1%, a difference of 0.85%), and Spanish American Indian (12.1%, a difference of 1.3%).
| Demographics | Rating | Rank | Unemployment Among Ages 20 to 24 years |
| Immigrants | Armenia | 0.0 /100 | #295 | Tragic 12.0% |
| Cajuns | 0.0 /100 | #296 | Tragic 12.0% |
| Blackfeet | 0.0 /100 | #297 | Tragic 12.0% |
| Lumbee | 0.0 /100 | #298 | Tragic 12.0% |
| Apache | 0.0 /100 | #299 | Tragic 12.0% |
| Spanish American Indians | 0.0 /100 | #300 | Tragic 12.1% |
| Immigrants | Sierra Leone | 0.0 /100 | #301 | Tragic 12.1% |
| Immigrants | Cabo Verde | 0.0 /100 | #302 | Tragic 12.2% |
| Haitians | 0.0 /100 | #303 | Tragic 12.2% |
| Immigrants | West Indies | 0.0 /100 | #304 | Tragic 12.3% |
| Chippewa | 0.0 /100 | #305 | Tragic 12.3% |
| Immigrants | Haiti | 0.0 /100 | #306 | Tragic 12.4% |
| Bermudans | 0.0 /100 | #307 | Tragic 12.5% |
| Tohono O'odham | 0.0 /100 | #308 | Tragic 12.5% |
| Immigrants | Bangladesh | 0.0 /100 | #309 | Tragic 12.6% |