Hmong vs Bhutanese Unemployment Among Youth under 25 years

COMPARE

Hmong
Race
Ancestry
AfghanAfricanAlaska NativeAlaskan AthabascanAlbanianAleutAlsatianAmericanApacheArabArapahoArgentineanArmenianAssyrian/Chaldean/SyriacAustralianAustrianBahamianBangladeshiBarbadianBasqueBelgianBelizeanBermudanBlackfeetBolivianBrazilianBritishBritish West IndianBulgarianBurmeseCajunCambodianCanadianCape VerdeanCarpatho RusynCelticCentral AmericanCentral American IndianCherokeeCheyenneChickasawChileanChineseChippewaChoctawColombianColvilleComancheCosta RicanCreeCreekCroatianCrowCubanCypriotCzechCzechoslovakianDanishDelawareDominicanDutchDutch West IndianEastern EuropeanEcuadorianEgyptianEnglishEstonianEthiopianEuropeanFijianFilipinoFinnishFrenchFrench American IndianFrench CanadianGermanGerman RussianGhanaianGreekGuamanian/ChamorroGuatemalanGuyaneseHaitianHmongHonduranHopiHoumaHungarianIcelanderIndian (Asian)IndonesianInupiatIranianIraqiIrishIroquoisIsraeliItalianJamaicanJapaneseJordanianKenyanKiowaKoreanLaotianLatvianLebaneseLiberianLithuanianLumbeeLuxembourgerMacedonianMalaysianMalteseMarshalleseMenomineeMexicanMexican American IndianMongolianMoroccanNative HawaiianNavajoNepaleseNew ZealanderNicaraguanNigerianNorthern EuropeanNorwegianOkinawanOsageOttawaPaiutePakistaniPalestinianPanamanianParaguayanPennsylvania GermanPeruvianPimaPolishPortuguesePotawatomiPuebloPuerto RicanPuget Sound SalishRomanianRussianSalvadoranSamoanScandinavianScotch-IrishScottishSeminoleSenegaleseSerbianShoshoneSierra LeoneanSiouxSlavicSlovakSloveneSomaliSouth AfricanSouth AmericanSouth American IndianSoviet UnionSpaniardSpanishSpanish AmericanSpanish American IndianSri LankanSubsaharan AfricanSudaneseSwedishSwissSyrianTaiwaneseThaiTlingit-HaidaTohono O'OdhamTonganTrinidadian and TobagonianTsimshianTurkishU.S. Virgin IslanderUgandanUkrainianUruguayanUteVenezuelanVietnameseWelshWest IndianYakamaYaquiYugoslavianYumanYup'ikZimbabwean
Immigration
NonimmigrantsImmigrantsAfghanistanAfricaAlbaniaArgentinaArmeniaAsiaAustraliaAustriaBahamasBangladeshBarbadosBelarusBelgiumBelizeBoliviaBosnia and HerzegovinaBrazilBulgariaBurma/MyanmarCabo VerdeCambodiaCameroonCanadaCaribbeanCentral AmericaChileChinaColombiaCongoCosta RicaCroatiaCubaCzechoslovakiaDenmarkDominicaDominican RepublicEastern AfricaEastern AsiaEastern EuropeEcuadorEgyptEl SalvadorEnglandEritreaEthiopiaEuropeFijiFranceGermanyGhanaGreeceGrenadaGuatemalaGuyanaHaitiHondurasHong KongHungaryIndiaIndonesiaIranIraqIrelandIsraelItalyJamaicaJapanJordanKazakhstanKenyaKoreaKuwaitLaosLatin AmericaLatviaLebanonLiberiaLithuaniaMalaysiaMexicoMicronesiaMiddle AfricaMoldovaMoroccoNepalNetherlandsNicaraguaNigeriaNorth AmericaNorth MacedoniaNorthern AfricaNorthern EuropeNorwayOceaniaPakistanPanamaPeruPhilippinesPolandPortugalRomaniaRussiaSaudi ArabiaScotlandSenegalSerbiaSierra LeoneSingaporeSomaliaSouth AfricaSouth AmericaSouth Central AsiaSouth Eastern AsiaSouthern EuropeSpainSri LankaSt. Vincent and the GrenadinesSudanSwedenSwitzerlandSyriaTaiwanThailandTrinidad and TobagoTurkeyUgandaUkraineUruguayUzbekistanVenezuelaVietnamWest IndiesWestern AfricaWestern AsiaWestern EuropeYemenZaireZimbabweAzores
Bhutanese
Race
Ancestry
AfghanAfricanAlaska NativeAlaskan AthabascanAlbanianAleutAlsatianAmericanApacheArabArapahoArgentineanArmenianAssyrian/Chaldean/SyriacAustralianAustrianBahamianBangladeshiBarbadianBasqueBelgianBelizeanBermudanBhutaneseBlackfeetBolivianBrazilianBritishBritish West IndianBulgarianBurmeseCajunCambodianCanadianCape VerdeanCarpatho RusynCelticCentral AmericanCentral American IndianCherokeeCheyenneChickasawChileanChineseChippewaChoctawColombianColvilleComancheCosta RicanCreeCreekCroatianCrowCubanCypriotCzechCzechoslovakianDanishDelawareDominicanDutchDutch West IndianEastern EuropeanEcuadorianEgyptianEnglishEstonianEthiopianEuropeanFijianFilipinoFinnishFrenchFrench American IndianFrench CanadianGermanGerman RussianGhanaianGreekGuamanian/ChamorroGuatemalanGuyaneseHaitianHonduranHopiHoumaHungarianIcelanderIndian (Asian)IndonesianInupiatIranianIraqiIrishIroquoisIsraeliItalianJamaicanJapaneseJordanianKenyanKiowaKoreanLaotianLatvianLebaneseLiberianLithuanianLumbeeLuxembourgerMacedonianMalaysianMalteseMarshalleseMenomineeMexicanMexican American IndianMongolianMoroccanNative HawaiianNavajoNepaleseNew ZealanderNicaraguanNigerianNorthern EuropeanNorwegianOkinawanOsageOttawaPaiutePakistaniPalestinianPanamanianParaguayanPennsylvania GermanPeruvianPimaPolishPortuguesePotawatomiPuebloPuerto RicanPuget Sound SalishRomanianRussianSalvadoranSamoanScandinavianScotch-IrishScottishSeminoleSenegaleseSerbianShoshoneSierra LeoneanSiouxSlavicSlovakSloveneSomaliSouth AfricanSouth AmericanSouth American IndianSoviet UnionSpaniardSpanishSpanish AmericanSpanish American IndianSri LankanSubsaharan AfricanSudaneseSwedishSwissSyrianTaiwaneseThaiTlingit-HaidaTohono O'OdhamTonganTrinidadian and TobagonianTsimshianTurkishU.S. Virgin IslanderUgandanUkrainianUruguayanUteVenezuelanVietnameseWelshWest IndianYakamaYaquiYugoslavianYumanYup'ikZimbabwean
Immigration
NonimmigrantsImmigrantsAfghanistanAfricaAlbaniaArgentinaArmeniaAsiaAustraliaAustriaBahamasBangladeshBarbadosBelarusBelgiumBelizeBoliviaBosnia and HerzegovinaBrazilBulgariaBurma/MyanmarCabo VerdeCambodiaCameroonCanadaCaribbeanCentral AmericaChileChinaColombiaCongoCosta RicaCroatiaCubaCzechoslovakiaDenmarkDominicaDominican RepublicEastern AfricaEastern AsiaEastern EuropeEcuadorEgyptEl SalvadorEnglandEritreaEthiopiaEuropeFijiFranceGermanyGhanaGreeceGrenadaGuatemalaGuyanaHaitiHondurasHong KongHungaryIndiaIndonesiaIranIraqIrelandIsraelItalyJamaicaJapanJordanKazakhstanKenyaKoreaKuwaitLaosLatin AmericaLatviaLebanonLiberiaLithuaniaMalaysiaMexicoMicronesiaMiddle AfricaMoldovaMoroccoNepalNetherlandsNicaraguaNigeriaNorth AmericaNorth MacedoniaNorthern AfricaNorthern EuropeNorwayOceaniaPakistanPanamaPeruPhilippinesPolandPortugalRomaniaRussiaSaudi ArabiaScotlandSenegalSerbiaSierra LeoneSingaporeSomaliaSouth AfricaSouth AmericaSouth Central AsiaSouth Eastern AsiaSouthern EuropeSpainSri LankaSt. Vincent and the GrenadinesSudanSwedenSwitzerlandSyriaTaiwanThailandTrinidad and TobagoTurkeyUgandaUkraineUruguayUzbekistanVenezuelaVietnamWest IndiesWestern AfricaWestern AsiaWestern EuropeYemenZaireZimbabweAzores
Unemployment Among Youth under 25 years
Income
Poverty
Unemployment
Labor Participation
Family Structure
Vehicle Availability
Education Level
Disability

Unemployment Among Youth under 25 years Comparison

Hmong

Bhutanese

Exceptional
Exceptional
10.8%
UNEMPLOYMENT AMONG YOUTH UNDER 25 YEARS
99.8/ 100
METRIC RATING
36th/ 347
METRIC RANK
11.2%
UNEMPLOYMENT AMONG YOUTH UNDER 25 YEARS
97.4/ 100
METRIC RATING
71st/ 347
METRIC RANK

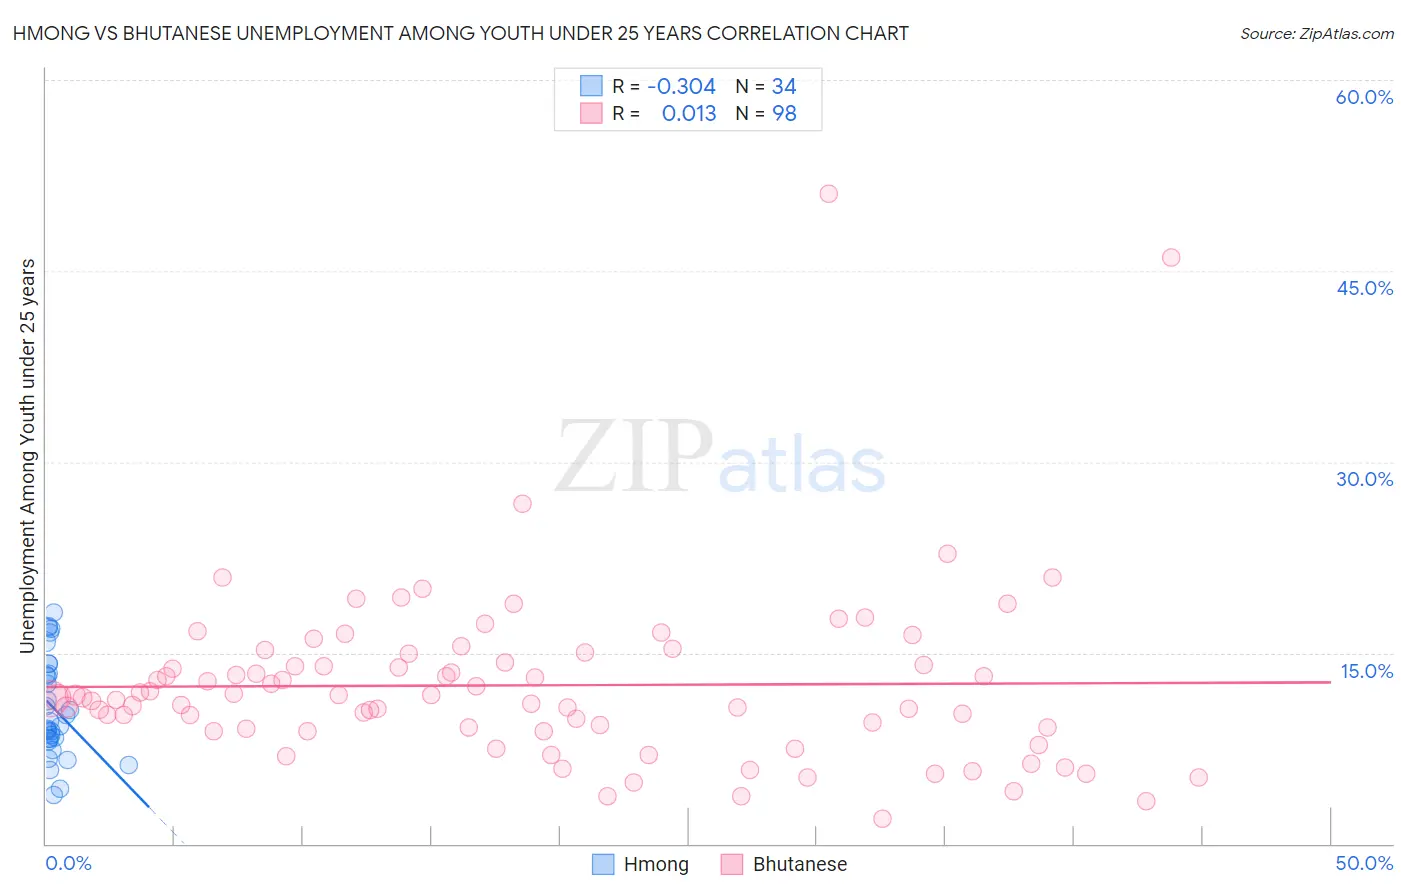
Hmong vs Bhutanese Unemployment Among Youth under 25 years Correlation Chart

The statistical analysis conducted on geographies consisting of 24,654,180 people shows a mild negative correlation between the proportion of Hmong and unemployment rate among youth under the age of 25 in the United States with a correlation coefficient (R) of -0.304 and weighted average of 10.8%. Similarly, the statistical analysis conducted on geographies consisting of 448,134,198 people shows no correlation between the proportion of Bhutanese and unemployment rate among youth under the age of 25 in the United States with a correlation coefficient (R) of 0.013 and weighted average of 11.2%, a difference of 3.1%.
Hmong vs Bhutanese Unemployment Among Youth under 25 years

Unemployment Among Youth under 25 years Correlation Summary

MeasurementHmongBhutanese
Minimum3.8%2.0%
Maximum18.2%51.1%
Range14.4%49.1%
Mean10.6%12.4%
Median9.4%11.5%
Interquartile 25% (IQ1)8.2%9.1%
Interquartile 75% (IQ3)13.4%14.2%
Interquartile Range (IQR)5.2%5.2%
Standard Deviation (Sample)3.9%7.0%
Standard Deviation (Population)3.9%7.0%

Similar Demographics by Unemployment Among Youth under 25 years

Demographics Similar to Hmong by Unemployment Among Youth under 25 years

In terms of unemployment among youth under 25 years, the demographic groups most similar to Hmong are Immigrants from Nepal (10.8%, a difference of 0.13%), Immigrants from Zimbabwe (10.8%, a difference of 0.15%), English (10.8%, a difference of 0.21%), Immigrants from Congo (10.9%, a difference of 0.23%), and Immigrants from Zaire (10.9%, a difference of 0.24%).
DemographicsRating | RankUnemployment Among Youth under 25 years
Chinese
99.9
/100
|
#29
Exceptional
10.7%
Osage
99.9
/100
|
#30
Exceptional
10.7%
Slovenes
99.9
/100
|
#31
Exceptional
10.7%
Taiwanese
99.9
/100
|
#32
Exceptional
10.8%
Europeans
99.9
/100
|
#33
Exceptional
10.8%
English
99.9
/100
|
#34
Exceptional
10.8%
Immigrants | Nepal
99.9
/100
|
#35
Exceptional
10.8%
Hmong
99.8
/100
|
#36
Exceptional
10.8%
Immigrants | Zimbabwe
99.8
/100
|
#37
Exceptional
10.8%
Immigrants | Congo
99.8
/100
|
#38
Exceptional
10.9%
Immigrants | Zaire
99.8
/100
|
#39
Exceptional
10.9%
Scottish
99.8
/100
|
#40
Exceptional
10.9%
Croatians
99.8
/100
|
#41
Exceptional
10.9%
Cambodians
99.7
/100
|
#42
Exceptional
10.9%
British
99.7
/100
|
#43
Exceptional
10.9%

Demographics Similar to Bhutanese by Unemployment Among Youth under 25 years

In terms of unemployment among youth under 25 years, the demographic groups most similar to Bhutanese are Immigrants from Moldova (11.2%, a difference of 0.040%), Slavic (11.2%, a difference of 0.040%), Immigrants from Australia (11.2%, a difference of 0.040%), Immigrants from Kenya (11.2%, a difference of 0.090%), and Creek (11.2%, a difference of 0.090%).
DemographicsRating | RankUnemployment Among Youth under 25 years
Jordanians
97.9
/100
|
#64
Exceptional
11.1%
Immigrants | Singapore
97.8
/100
|
#65
Exceptional
11.2%
Macedonians
97.7
/100
|
#66
Exceptional
11.2%
Chickasaw
97.7
/100
|
#67
Exceptional
11.2%
Immigrants | Kenya
97.6
/100
|
#68
Exceptional
11.2%
Immigrants | Moldova
97.5
/100
|
#69
Exceptional
11.2%
Slavs
97.5
/100
|
#70
Exceptional
11.2%
Bhutanese
97.4
/100
|
#71
Exceptional
11.2%
Immigrants | Australia
97.3
/100
|
#72
Exceptional
11.2%
Creek
97.2
/100
|
#73
Exceptional
11.2%
New Zealanders
97.2
/100
|
#74
Exceptional
11.2%
French
97.1
/100
|
#75
Exceptional
11.2%
German Russians
97.0
/100
|
#76
Exceptional
11.2%
Whites/Caucasians
96.9
/100
|
#77
Exceptional
11.2%
Immigrants | Nicaragua
96.7
/100
|
#78
Exceptional
11.2%