Hispanic or Latino vs Alsatian Unemployment Among Ages 55 to 59 years
COMPARE
Hispanic or Latino
Alsatian
Unemployment Among Ages 55 to 59 years
Unemployment Among Ages 55 to 59 years Comparison
Hispanics or Latinos
Alsatians
5.4%
UNEMPLOYMENT AMONG AGES 55 TO 59 YEARS
0.0/ 100
METRIC RATING
298th/ 347
METRIC RANK
5.2%
UNEMPLOYMENT AMONG AGES 55 TO 59 YEARS
0.0/ 100
METRIC RATING
279th/ 347
METRIC RANK
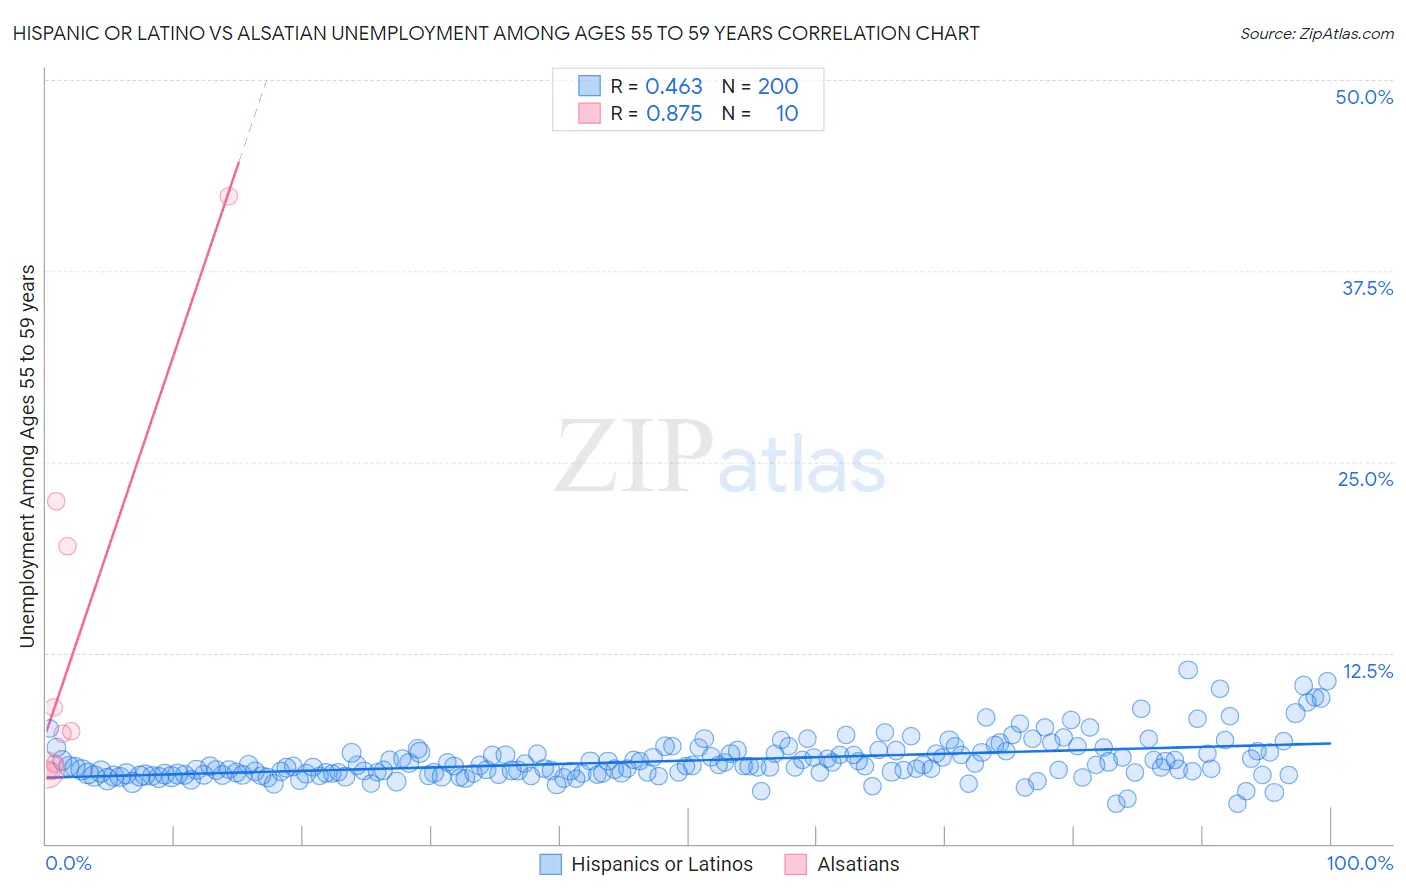
Hispanic or Latino vs Alsatian Unemployment Among Ages 55 to 59 years Correlation Chart
The statistical analysis conducted on geographies consisting of 491,082,633 people shows a moderate positive correlation between the proportion of Hispanics or Latinos and unemployment rate among population between the ages 55 and 59 in the United States with a correlation coefficient (R) of 0.463 and weighted average of 5.4%. Similarly, the statistical analysis conducted on geographies consisting of 80,463,292 people shows a very strong positive correlation between the proportion of Alsatians and unemployment rate among population between the ages 55 and 59 in the United States with a correlation coefficient (R) of 0.875 and weighted average of 5.2%, a difference of 2.3%.
Unemployment Among Ages 55 to 59 years Correlation Summary
| Measurement | Hispanic or Latino | Alsatian |
| Minimum | 2.6% | 4.7% |
| Maximum | 11.4% | 42.4% |
| Range | 8.7% | 37.7% |
| Mean | 5.4% | 12.7% |
| Median | 5.1% | 7.3% |
| Interquartile 25% (IQ1) | 4.6% | 4.8% |
| Interquartile 75% (IQ3) | 5.9% | 19.5% |
| Interquartile Range (IQR) | 1.4% | 14.7% |
| Standard Deviation (Sample) | 1.4% | 12.2% |
| Standard Deviation (Population) | 1.4% | 11.6% |
Demographics Similar to Hispanics or Latinos and Alsatians by Unemployment Among Ages 55 to 59 years
In terms of unemployment among ages 55 to 59 years, the demographic groups most similar to Hispanics or Latinos are Immigrants from Mexico (5.3%, a difference of 0.38%), Barbadian (5.3%, a difference of 0.60%), Dutch West Indian (5.3%, a difference of 0.64%), Cajun (5.3%, a difference of 0.76%), and Immigrants from Grenada (5.3%, a difference of 0.88%). Similarly, the demographic groups most similar to Alsatians are Immigrants from Barbados (5.2%, a difference of 0.11%), Immigrants from Uzbekistan (5.3%, a difference of 0.21%), Guatemalan (5.3%, a difference of 0.36%), Immigrants from Trinidad and Tobago (5.3%, a difference of 0.62%), and Apache (5.3%, a difference of 0.66%).
| Demographics | Rating | Rank | Unemployment Among Ages 55 to 59 years |
| Immigrants | Barbados | 0.0 /100 | #278 | Tragic 5.2% |
| Alsatians | 0.0 /100 | #279 | Tragic 5.2% |
| Immigrants | Uzbekistan | 0.0 /100 | #280 | Tragic 5.3% |
| Guatemalans | 0.0 /100 | #281 | Tragic 5.3% |
| Immigrants | Trinidad and Tobago | 0.0 /100 | #282 | Tragic 5.3% |
| Apache | 0.0 /100 | #283 | Tragic 5.3% |
| Ghanaians | 0.0 /100 | #284 | Tragic 5.3% |
| Armenians | 0.0 /100 | #285 | Tragic 5.3% |
| Immigrants | Ghana | 0.0 /100 | #286 | Tragic 5.3% |
| Immigrants | Guatemala | 0.0 /100 | #287 | Tragic 5.3% |
| Immigrants | Israel | 0.0 /100 | #288 | Tragic 5.3% |
| Immigrants | Central America | 0.0 /100 | #289 | Tragic 5.3% |
| Sioux | 0.0 /100 | #290 | Tragic 5.3% |
| Trinidadians and Tobagonians | 0.0 /100 | #291 | Tragic 5.3% |
| British West Indians | 0.0 /100 | #292 | Tragic 5.3% |
| Immigrants | Grenada | 0.0 /100 | #293 | Tragic 5.3% |
| Cajuns | 0.0 /100 | #294 | Tragic 5.3% |
| Dutch West Indians | 0.0 /100 | #295 | Tragic 5.3% |
| Barbadians | 0.0 /100 | #296 | Tragic 5.3% |
| Immigrants | Mexico | 0.0 /100 | #297 | Tragic 5.3% |
| Hispanics or Latinos | 0.0 /100 | #298 | Tragic 5.4% |