Hispanic or Latino vs Albanian Unemployment Among Ages 25 to 29 years
COMPARE
Hispanic or Latino
Albanian
Unemployment Among Ages 25 to 29 years
Unemployment Among Ages 25 to 29 years Comparison
Hispanics or Latinos
Albanians
7.7%
UNEMPLOYMENT AMONG AGES 25 TO 29 YEARS
0.0/ 100
METRIC RATING
291st/ 347
METRIC RANK
6.6%
UNEMPLOYMENT AMONG AGES 25 TO 29 YEARS
53.5/ 100
METRIC RATING
170th/ 347
METRIC RANK
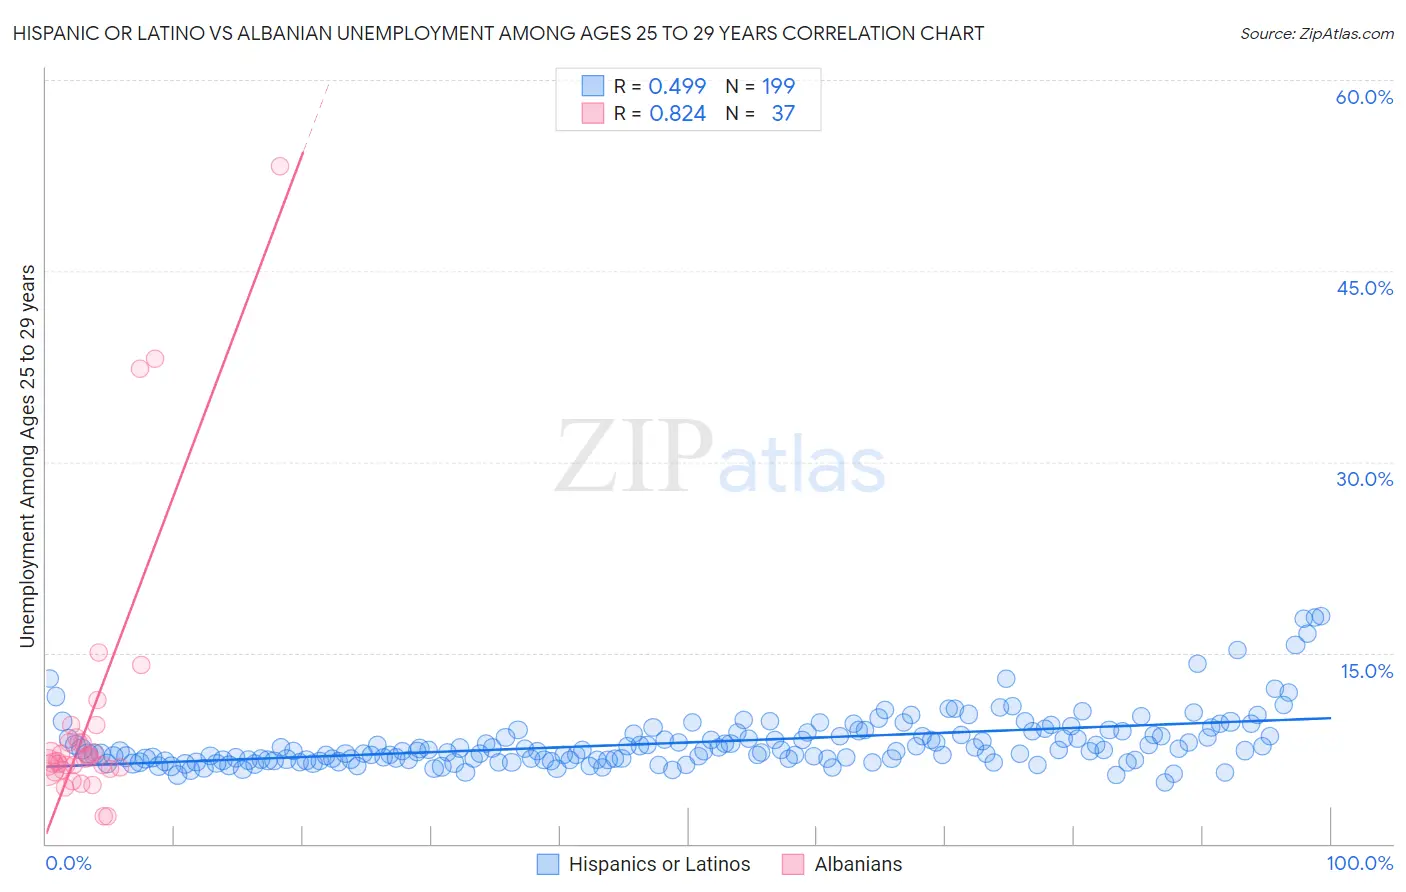
Hispanic or Latino vs Albanian Unemployment Among Ages 25 to 29 years Correlation Chart
The statistical analysis conducted on geographies consisting of 511,176,704 people shows a moderate positive correlation between the proportion of Hispanics or Latinos and unemployment rate among population between the ages 25 and 29 in the United States with a correlation coefficient (R) of 0.499 and weighted average of 7.7%. Similarly, the statistical analysis conducted on geographies consisting of 187,118,297 people shows a very strong positive correlation between the proportion of Albanians and unemployment rate among population between the ages 25 and 29 in the United States with a correlation coefficient (R) of 0.824 and weighted average of 6.6%, a difference of 16.5%.
Unemployment Among Ages 25 to 29 years Correlation Summary
| Measurement | Hispanic or Latino | Albanian |
| Minimum | 4.8% | 2.2% |
| Maximum | 17.9% | 53.2% |
| Range | 13.1% | 51.0% |
| Mean | 7.9% | 9.9% |
| Median | 7.3% | 6.6% |
| Interquartile 25% (IQ1) | 6.6% | 5.9% |
| Interquartile 75% (IQ3) | 8.7% | 8.2% |
| Interquartile Range (IQR) | 2.1% | 2.2% |
| Standard Deviation (Sample) | 2.2% | 10.5% |
| Standard Deviation (Population) | 2.2% | 10.3% |
Similar Demographics by Unemployment Among Ages 25 to 29 years
Demographics Similar to Hispanics or Latinos by Unemployment Among Ages 25 to 29 years
In terms of unemployment among ages 25 to 29 years, the demographic groups most similar to Hispanics or Latinos are Armenian (7.7%, a difference of 0.39%), Chippewa (7.8%, a difference of 0.41%), Immigrants from Belize (7.8%, a difference of 0.46%), Belizean (7.7%, a difference of 0.49%), and Trinidadian and Tobagonian (7.8%, a difference of 0.74%).
| Demographics | Rating | Rank | Unemployment Among Ages 25 to 29 years |
| Cherokee | 0.0 /100 | #284 | Tragic 7.6% |
| Senegalese | 0.0 /100 | #285 | Tragic 7.6% |
| Vietnamese | 0.0 /100 | #286 | Tragic 7.6% |
| Immigrants | Mexico | 0.0 /100 | #287 | Tragic 7.6% |
| Africans | 0.0 /100 | #288 | Tragic 7.6% |
| Belizeans | 0.0 /100 | #289 | Tragic 7.7% |
| Armenians | 0.0 /100 | #290 | Tragic 7.7% |
| Hispanics or Latinos | 0.0 /100 | #291 | Tragic 7.7% |
| Chippewa | 0.0 /100 | #292 | Tragic 7.8% |
| Immigrants | Belize | 0.0 /100 | #293 | Tragic 7.8% |
| Trinidadians and Tobagonians | 0.0 /100 | #294 | Tragic 7.8% |
| Comanche | 0.0 /100 | #295 | Tragic 7.8% |
| Immigrants | West Indies | 0.0 /100 | #296 | Tragic 7.8% |
| Blackfeet | 0.0 /100 | #297 | Tragic 7.9% |
| Immigrants | Trinidad and Tobago | 0.0 /100 | #298 | Tragic 7.9% |
Demographics Similar to Albanians by Unemployment Among Ages 25 to 29 years
In terms of unemployment among ages 25 to 29 years, the demographic groups most similar to Albanians are South American (6.6%, a difference of 0.060%), Immigrants from Cambodia (6.6%, a difference of 0.060%), Estonian (6.6%, a difference of 0.080%), Immigrants from Canada (6.6%, a difference of 0.090%), and Bangladeshi (6.6%, a difference of 0.12%).
| Demographics | Rating | Rank | Unemployment Among Ages 25 to 29 years |
| Immigrants | Middle Africa | 59.4 /100 | #163 | Average 6.6% |
| Greeks | 58.5 /100 | #164 | Average 6.6% |
| English | 58.0 /100 | #165 | Average 6.6% |
| Immigrants | Northern Europe | 57.3 /100 | #166 | Average 6.6% |
| Immigrants | Canada | 55.0 /100 | #167 | Average 6.6% |
| Estonians | 54.8 /100 | #168 | Average 6.6% |
| South Americans | 54.5 /100 | #169 | Average 6.6% |
| Albanians | 53.5 /100 | #170 | Average 6.6% |
| Immigrants | Cambodia | 52.6 /100 | #171 | Average 6.6% |
| Bangladeshis | 51.6 /100 | #172 | Average 6.6% |
| Russians | 51.3 /100 | #173 | Average 6.6% |
| Immigrants | North America | 50.0 /100 | #174 | Average 6.6% |
| Immigrants | South Eastern Asia | 49.1 /100 | #175 | Average 6.7% |
| Osage | 48.1 /100 | #176 | Average 6.7% |
| Immigrants | Israel | 47.8 /100 | #177 | Average 6.7% |