Hawaiian vs Dutch West Indian Unemployment Among Ages 25 to 29 years

COMPARE

Hawaiian
Race
Ancestry
AfghanAfricanAlaska NativeAlaskan AthabascanAlbanianAleutAlsatianAmericanApacheArabArapahoArgentineanArmenianAssyrian/Chaldean/SyriacAustralianAustrianBahamianBangladeshiBarbadianBasqueBelgianBelizeanBermudanBhutaneseBlackfeetBolivianBrazilianBritishBritish West IndianBulgarianBurmeseCajunCambodianCanadianCape VerdeanCarpatho RusynCelticCentral AmericanCentral American IndianCherokeeCheyenneChickasawChileanChineseChippewaChoctawColombianColvilleComancheCosta RicanCreeCreekCroatianCrowCubanCypriotCzechCzechoslovakianDanishDelawareDominicanDutchEastern EuropeanEcuadorianEgyptianEnglishEstonianEthiopianEuropeanFijianFilipinoFinnishFrenchFrench American IndianFrench CanadianGermanGerman RussianGhanaianGreekGuamanian/ChamorroGuatemalanGuyaneseHaitianHmongHonduranHopiHoumaHungarianIcelanderIndian (Asian)IndonesianInupiatIranianIraqiIrishIroquoisIsraeliItalianJamaicanJapaneseJordanianKenyanKiowaKoreanLaotianLatvianLebaneseLiberianLithuanianLumbeeLuxembourgerMacedonianMalaysianMalteseMarshalleseMenomineeMexicanMexican American IndianMongolianMoroccanNative HawaiianNavajoNepaleseNew ZealanderNicaraguanNigerianNorthern EuropeanNorwegianOkinawanOsageOttawaPaiutePakistaniPalestinianPanamanianParaguayanPennsylvania GermanPeruvianPimaPolishPortuguesePotawatomiPuebloPuerto RicanPuget Sound SalishRomanianRussianSalvadoranSamoanScandinavianScotch-IrishScottishSeminoleSenegaleseSerbianShoshoneSierra LeoneanSiouxSlavicSlovakSloveneSomaliSouth AfricanSouth AmericanSouth American IndianSoviet UnionSpaniardSpanishSpanish AmericanSpanish American IndianSri LankanSubsaharan AfricanSudaneseSwedishSwissSyrianTaiwaneseThaiTlingit-HaidaTohono O'OdhamTonganTrinidadian and TobagonianTsimshianTurkishU.S. Virgin IslanderUgandanUkrainianUruguayanUteVenezuelanVietnameseWelshWest IndianYakamaYaquiYugoslavianYumanYup'ikZimbabwean
Immigration
NonimmigrantsImmigrantsAfghanistanAfricaAlbaniaArgentinaArmeniaAsiaAustraliaAustriaBahamasBangladeshBarbadosBelarusBelgiumBelizeBoliviaBosnia and HerzegovinaBrazilBulgariaBurma/MyanmarCabo VerdeCambodiaCameroonCanadaCaribbeanCentral AmericaChileChinaColombiaCongoCosta RicaCroatiaCubaCzechoslovakiaDenmarkDominicaDominican RepublicEastern AfricaEastern AsiaEastern EuropeEcuadorEgyptEl SalvadorEnglandEritreaEthiopiaEuropeFijiFranceGermanyGhanaGreeceGrenadaGuatemalaGuyanaHaitiHondurasHong KongHungaryIndiaIndonesiaIranIraqIrelandIsraelItalyJamaicaJapanJordanKazakhstanKenyaKoreaKuwaitLaosLatin AmericaLatviaLebanonLiberiaLithuaniaMalaysiaMexicoMicronesiaMiddle AfricaMoldovaMoroccoNepalNetherlandsNicaraguaNigeriaNorth AmericaNorth MacedoniaNorthern AfricaNorthern EuropeNorwayOceaniaPakistanPanamaPeruPhilippinesPolandPortugalRomaniaRussiaSaudi ArabiaScotlandSenegalSerbiaSierra LeoneSingaporeSomaliaSouth AfricaSouth AmericaSouth Central AsiaSouth Eastern AsiaSouthern EuropeSpainSri LankaSt. Vincent and the GrenadinesSudanSwedenSwitzerlandSyriaTaiwanThailandTrinidad and TobagoTurkeyUgandaUkraineUruguayUzbekistanVenezuelaVietnamWest IndiesWestern AfricaWestern AsiaWestern EuropeYemenZaireZimbabweAzores
Dutch West Indian
Race
Ancestry
AfghanAfricanAlaska NativeAlaskan AthabascanAlbanianAleutAlsatianAmericanApacheArabArapahoArgentineanArmenianAssyrian/Chaldean/SyriacAustralianAustrianBahamianBangladeshiBarbadianBasqueBelgianBelizeanBermudanBhutaneseBlackfeetBolivianBrazilianBritishBritish West IndianBulgarianBurmeseCajunCambodianCanadianCape VerdeanCarpatho RusynCelticCentral AmericanCentral American IndianCherokeeCheyenneChickasawChileanChineseChippewaChoctawColombianColvilleComancheCosta RicanCreeCreekCroatianCrowCubanCypriotCzechCzechoslovakianDanishDelawareDominicanDutchDutch West IndianEastern EuropeanEcuadorianEgyptianEnglishEstonianEthiopianEuropeanFijianFilipinoFinnishFrenchFrench American IndianFrench CanadianGermanGerman RussianGhanaianGreekGuamanian/ChamorroGuatemalanGuyaneseHaitianHmongHonduranHopiHoumaHungarianIcelanderIndian (Asian)IndonesianInupiatIranianIraqiIrishIroquoisIsraeliItalianJamaicanJapaneseJordanianKenyanKiowaKoreanLaotianLatvianLebaneseLiberianLithuanianLumbeeLuxembourgerMacedonianMalaysianMalteseMarshalleseMenomineeMexicanMexican American IndianMongolianMoroccanNative HawaiianNavajoNepaleseNew ZealanderNicaraguanNigerianNorthern EuropeanNorwegianOkinawanOsageOttawaPaiutePakistaniPalestinianPanamanianParaguayanPennsylvania GermanPeruvianPimaPolishPortuguesePotawatomiPuebloPuerto RicanPuget Sound SalishRomanianRussianSalvadoranSamoanScandinavianScotch-IrishScottishSeminoleSenegaleseSerbianShoshoneSierra LeoneanSiouxSlavicSlovakSloveneSomaliSouth AfricanSouth AmericanSouth American IndianSoviet UnionSpaniardSpanishSpanish AmericanSpanish American IndianSri LankanSubsaharan AfricanSudaneseSwedishSwissSyrianTaiwaneseThaiTlingit-HaidaTohono O'OdhamTonganTrinidadian and TobagonianTsimshianTurkishU.S. Virgin IslanderUgandanUkrainianUruguayanUteVenezuelanVietnameseWelshWest IndianYakamaYaquiYugoslavianYumanYup'ikZimbabwean
Immigration
NonimmigrantsImmigrantsAfghanistanAfricaAlbaniaArgentinaArmeniaAsiaAustraliaAustriaBahamasBangladeshBarbadosBelarusBelgiumBelizeBoliviaBosnia and HerzegovinaBrazilBulgariaBurma/MyanmarCabo VerdeCambodiaCameroonCanadaCaribbeanCentral AmericaChileChinaColombiaCongoCosta RicaCroatiaCubaCzechoslovakiaDenmarkDominicaDominican RepublicEastern AfricaEastern AsiaEastern EuropeEcuadorEgyptEl SalvadorEnglandEritreaEthiopiaEuropeFijiFranceGermanyGhanaGreeceGrenadaGuatemalaGuyanaHaitiHondurasHong KongHungaryIndiaIndonesiaIranIraqIrelandIsraelItalyJamaicaJapanJordanKazakhstanKenyaKoreaKuwaitLaosLatin AmericaLatviaLebanonLiberiaLithuaniaMalaysiaMexicoMicronesiaMiddle AfricaMoldovaMoroccoNepalNetherlandsNicaraguaNigeriaNorth AmericaNorth MacedoniaNorthern AfricaNorthern EuropeNorwayOceaniaPakistanPanamaPeruPhilippinesPolandPortugalRomaniaRussiaSaudi ArabiaScotlandSenegalSerbiaSierra LeoneSingaporeSomaliaSouth AfricaSouth AmericaSouth Central AsiaSouth Eastern AsiaSouthern EuropeSpainSri LankaSt. Vincent and the GrenadinesSudanSwedenSwitzerlandSyriaTaiwanThailandTrinidad and TobagoTurkeyUgandaUkraineUruguayUzbekistanVenezuelaVietnamWest IndiesWestern AfricaWestern AsiaWestern EuropeYemenZaireZimbabweAzores
Unemployment Among Ages 25 to 29 years
Income
Poverty
Unemployment
Labor Participation
Family Structure
Vehicle Availability
Education Level
Disability

Unemployment Among Ages 25 to 29 years Comparison

Hawaiians

Dutch West Indians

Poor
Tragic
6.8%
UNEMPLOYMENT AMONG AGES 25 TO 29 YEARS
17.1/ 100
METRIC RATING
209th/ 347
METRIC RANK
8.2%
UNEMPLOYMENT AMONG AGES 25 TO 29 YEARS
0.0/ 100
METRIC RATING
312th/ 347
METRIC RANK

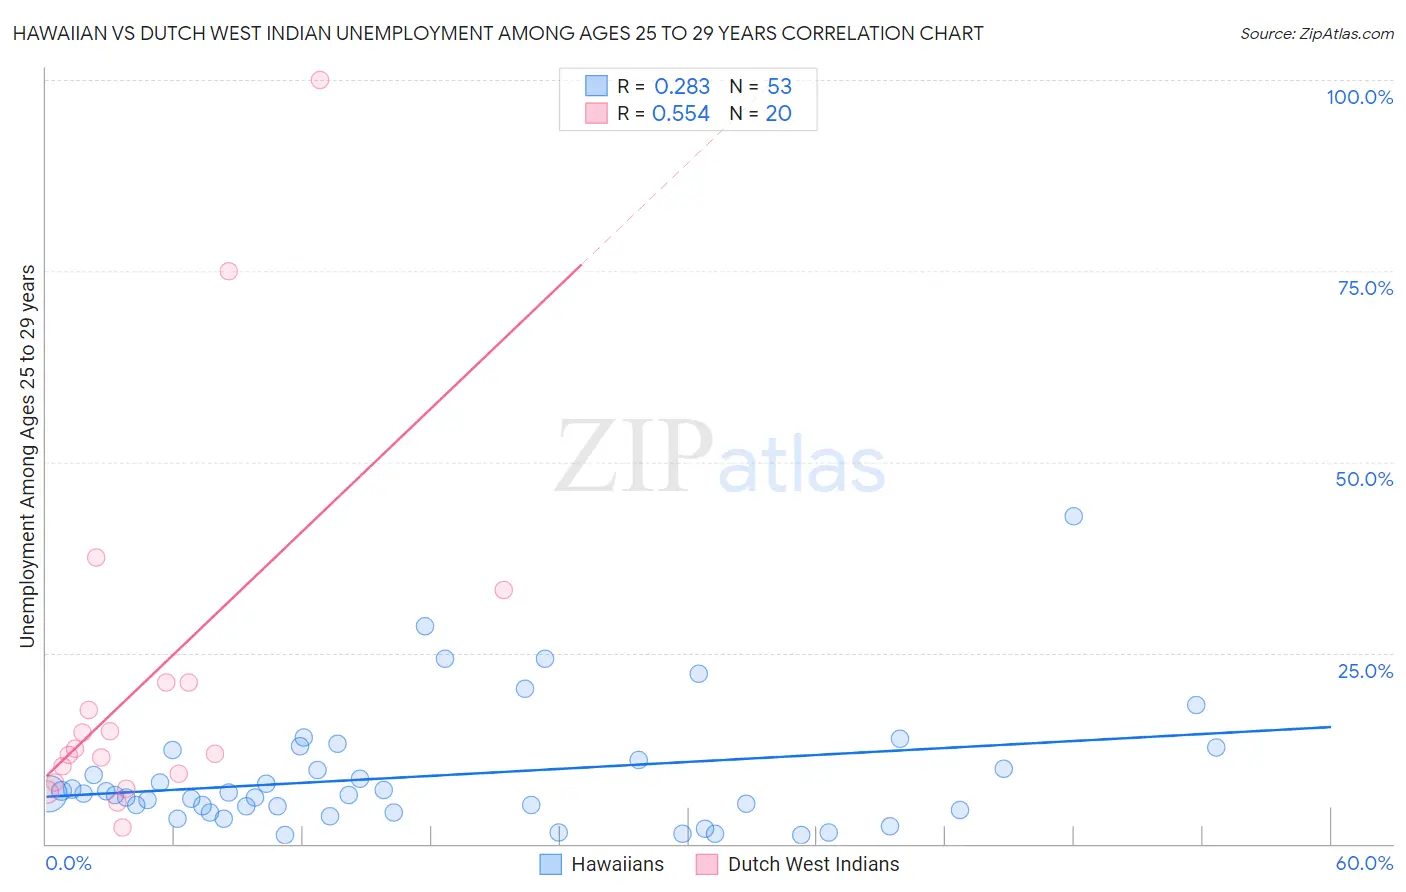
Hawaiian vs Dutch West Indian Unemployment Among Ages 25 to 29 years Correlation Chart

The statistical analysis conducted on geographies consisting of 314,743,173 people shows a weak positive correlation between the proportion of Hawaiians and unemployment rate among population between the ages 25 and 29 in the United States with a correlation coefficient (R) of 0.283 and weighted average of 6.8%. Similarly, the statistical analysis conducted on geographies consisting of 83,674,988 people shows a substantial positive correlation between the proportion of Dutch West Indians and unemployment rate among population between the ages 25 and 29 in the United States with a correlation coefficient (R) of 0.554 and weighted average of 8.2%, a difference of 20.3%.
Hawaiian vs Dutch West Indian Unemployment Among Ages 25 to 29 years

Unemployment Among Ages 25 to 29 years Correlation Summary

MeasurementHawaiianDutch West Indian
Minimum1.1%2.2%
Maximum42.9%100.0%
Range41.8%97.8%
Mean8.9%21.5%
Median6.5%12.1%
Interquartile 25% (IQ1)4.3%8.6%
Interquartile 75% (IQ3)11.7%21.1%
Interquartile Range (IQR)7.4%12.5%
Standard Deviation (Sample)7.9%24.5%
Standard Deviation (Population)7.9%23.9%

Similar Demographics by Unemployment Among Ages 25 to 29 years

Demographics Similar to Hawaiians by Unemployment Among Ages 25 to 29 years

In terms of unemployment among ages 25 to 29 years, the demographic groups most similar to Hawaiians are Canadian (6.8%, a difference of 0.020%), Immigrants from Philippines (6.8%, a difference of 0.050%), Immigrants from Cabo Verde (6.8%, a difference of 0.10%), Immigrants from Germany (6.8%, a difference of 0.18%), and Immigrants from Denmark (6.8%, a difference of 0.20%).
DemographicsRating | RankUnemployment Among Ages 25 to 29 years
Immigrants | Argentina
21.6
/100
|
#202
Fair
6.8%
Immigrants | Norway
21.2
/100
|
#203
Fair
6.8%
Scotch-Irish
20.0
/100
|
#204
Poor
6.8%
Immigrants | England
19.8
/100
|
#205
Poor
6.8%
Ugandans
19.8
/100
|
#206
Poor
6.8%
Immigrants | Denmark
19.0
/100
|
#207
Poor
6.8%
Immigrants | Germany
18.8
/100
|
#208
Poor
6.8%
Hawaiians
17.1
/100
|
#209
Poor
6.8%
Canadians
16.9
/100
|
#210
Poor
6.8%
Immigrants | Philippines
16.7
/100
|
#211
Poor
6.8%
Immigrants | Cabo Verde
16.2
/100
|
#212
Poor
6.8%
Immigrants | Syria
15.1
/100
|
#213
Poor
6.8%
Liberians
14.7
/100
|
#214
Poor
6.8%
Spanish
14.4
/100
|
#215
Poor
6.8%
Slovaks
14.3
/100
|
#216
Poor
6.8%

Demographics Similar to Dutch West Indians by Unemployment Among Ages 25 to 29 years

In terms of unemployment among ages 25 to 29 years, the demographic groups most similar to Dutch West Indians are Immigrants from the Azores (8.1%, a difference of 1.1%), U.S. Virgin Islander (8.1%, a difference of 1.3%), Immigrants from Haiti (8.1%, a difference of 1.3%), Immigrants from Jamaica (8.1%, a difference of 1.3%), and Immigrants from Barbados (8.0%, a difference of 1.8%).
DemographicsRating | RankUnemployment Among Ages 25 to 29 years
Tsimshian
0.0
/100
|
#305
Tragic
8.0%
Haitians
0.0
/100
|
#306
Tragic
8.0%
Immigrants | Barbados
0.0
/100
|
#307
Tragic
8.0%
Immigrants | Jamaica
0.0
/100
|
#308
Tragic
8.1%
Immigrants | Haiti
0.0
/100
|
#309
Tragic
8.1%
U.S. Virgin Islanders
0.0
/100
|
#310
Tragic
8.1%
Immigrants | Azores
0.0
/100
|
#311
Tragic
8.1%
Dutch West Indians
0.0
/100
|
#312
Tragic
8.2%
Immigrants | St. Vincent and the Grenadines
0.0
/100
|
#313
Tragic
8.4%
Immigrants | Dominica
0.0
/100
|
#314
Tragic
8.4%
British West Indians
0.0
/100
|
#315
Tragic
8.4%
Immigrants | Grenada
0.0
/100
|
#316
Tragic
8.4%
Immigrants | Guyana
0.0
/100
|
#317
Tragic
8.5%
Guyanese
0.0
/100
|
#318
Tragic
8.5%
Immigrants | Armenia
0.0
/100
|
#319
Tragic
8.5%