Haitian vs New Zealander Unemployment Among Ages 35 to 44 years

COMPARE

Haitian
Race
Ancestry
AfghanAfricanAlaska NativeAlaskan AthabascanAlbanianAleutAlsatianAmericanApacheArabArapahoArgentineanArmenianAssyrian/Chaldean/SyriacAustralianAustrianBahamianBangladeshiBarbadianBasqueBelgianBelizeanBermudanBhutaneseBlackfeetBolivianBrazilianBritishBritish West IndianBulgarianBurmeseCajunCambodianCanadianCape VerdeanCarpatho RusynCelticCentral AmericanCentral American IndianCherokeeCheyenneChickasawChileanChineseChippewaChoctawColombianColvilleComancheCosta RicanCreeCreekCroatianCrowCubanCypriotCzechCzechoslovakianDanishDelawareDominicanDutchDutch West IndianEastern EuropeanEcuadorianEgyptianEnglishEstonianEthiopianEuropeanFijianFilipinoFinnishFrenchFrench American IndianFrench CanadianGermanGerman RussianGhanaianGreekGuamanian/ChamorroGuatemalanGuyaneseHaitianHmongHonduranHopiHoumaHungarianIcelanderIndian (Asian)IndonesianInupiatIranianIraqiIrishIroquoisIsraeliItalianJamaicanJapaneseJordanianKenyanKiowaKoreanLaotianLatvianLebaneseLiberianLithuanianLumbeeLuxembourgerMacedonianMalaysianMalteseMarshalleseMenomineeMexicanMexican American IndianMongolianMoroccanNative HawaiianNavajoNepaleseNicaraguanNigerianNorthern EuropeanNorwegianOkinawanOsageOttawaPaiutePakistaniPalestinianPanamanianParaguayanPennsylvania GermanPeruvianPimaPolishPortuguesePotawatomiPuebloPuerto RicanPuget Sound SalishRomanianRussianSalvadoranSamoanScandinavianScotch-IrishScottishSeminoleSenegaleseSerbianShoshoneSierra LeoneanSiouxSlavicSlovakSloveneSomaliSouth AfricanSouth AmericanSouth American IndianSoviet UnionSpaniardSpanishSpanish AmericanSpanish American IndianSri LankanSubsaharan AfricanSudaneseSwedishSwissSyrianTaiwaneseThaiTlingit-HaidaTohono O'OdhamTonganTrinidadian and TobagonianTsimshianTurkishU.S. Virgin IslanderUgandanUkrainianUruguayanUteVenezuelanVietnameseWelshWest IndianYakamaYaquiYugoslavianYumanYup'ikZimbabwean
Immigration
NonimmigrantsImmigrantsAfghanistanAfricaAlbaniaArgentinaArmeniaAsiaAustraliaAustriaBahamasBangladeshBarbadosBelarusBelgiumBelizeBoliviaBosnia and HerzegovinaBrazilBulgariaBurma/MyanmarCabo VerdeCambodiaCameroonCanadaCaribbeanCentral AmericaChileChinaColombiaCongoCosta RicaCroatiaCubaCzechoslovakiaDenmarkDominicaDominican RepublicEastern AfricaEastern AsiaEastern EuropeEcuadorEgyptEl SalvadorEnglandEritreaEthiopiaEuropeFijiFranceGermanyGhanaGreeceGrenadaGuatemalaGuyanaHaitiHondurasHong KongHungaryIndiaIndonesiaIranIraqIrelandIsraelItalyJamaicaJapanJordanKazakhstanKenyaKoreaKuwaitLaosLatin AmericaLatviaLebanonLiberiaLithuaniaMalaysiaMexicoMicronesiaMiddle AfricaMoldovaMoroccoNepalNetherlandsNicaraguaNigeriaNorth AmericaNorth MacedoniaNorthern AfricaNorthern EuropeNorwayOceaniaPakistanPanamaPeruPhilippinesPolandPortugalRomaniaRussiaSaudi ArabiaScotlandSenegalSerbiaSierra LeoneSingaporeSomaliaSouth AfricaSouth AmericaSouth Central AsiaSouth Eastern AsiaSouthern EuropeSpainSri LankaSt. Vincent and the GrenadinesSudanSwedenSwitzerlandSyriaTaiwanThailandTrinidad and TobagoTurkeyUgandaUkraineUruguayUzbekistanVenezuelaVietnamWest IndiesWestern AfricaWestern AsiaWestern EuropeYemenZaireZimbabweAzores
New Zealander
Race
Ancestry
AfghanAfricanAlaska NativeAlaskan AthabascanAlbanianAleutAlsatianAmericanApacheArabArapahoArgentineanArmenianAssyrian/Chaldean/SyriacAustralianAustrianBahamianBangladeshiBarbadianBasqueBelgianBelizeanBermudanBhutaneseBlackfeetBolivianBrazilianBritishBritish West IndianBulgarianBurmeseCajunCambodianCanadianCape VerdeanCarpatho RusynCelticCentral AmericanCentral American IndianCherokeeCheyenneChickasawChileanChineseChippewaChoctawColombianColvilleComancheCosta RicanCreeCreekCroatianCrowCubanCypriotCzechCzechoslovakianDanishDelawareDominicanDutchDutch West IndianEastern EuropeanEcuadorianEgyptianEnglishEstonianEthiopianEuropeanFijianFilipinoFinnishFrenchFrench American IndianFrench CanadianGermanGerman RussianGhanaianGreekGuamanian/ChamorroGuatemalanGuyaneseHmongHonduranHopiHoumaHungarianIcelanderIndian (Asian)IndonesianInupiatIranianIraqiIrishIroquoisIsraeliItalianJamaicanJapaneseJordanianKenyanKiowaKoreanLaotianLatvianLebaneseLiberianLithuanianLumbeeLuxembourgerMacedonianMalaysianMalteseMarshalleseMenomineeMexicanMexican American IndianMongolianMoroccanNative HawaiianNavajoNepaleseNew ZealanderNicaraguanNigerianNorthern EuropeanNorwegianOkinawanOsageOttawaPaiutePakistaniPalestinianPanamanianParaguayanPennsylvania GermanPeruvianPimaPolishPortuguesePotawatomiPuebloPuerto RicanPuget Sound SalishRomanianRussianSalvadoranSamoanScandinavianScotch-IrishScottishSeminoleSenegaleseSerbianShoshoneSierra LeoneanSiouxSlavicSlovakSloveneSomaliSouth AfricanSouth AmericanSouth American IndianSoviet UnionSpaniardSpanishSpanish AmericanSpanish American IndianSri LankanSubsaharan AfricanSudaneseSwedishSwissSyrianTaiwaneseThaiTlingit-HaidaTohono O'OdhamTonganTrinidadian and TobagonianTsimshianTurkishU.S. Virgin IslanderUgandanUkrainianUruguayanUteVenezuelanVietnameseWelshWest IndianYakamaYaquiYugoslavianYumanYup'ikZimbabwean
Immigration
NonimmigrantsImmigrantsAfghanistanAfricaAlbaniaArgentinaArmeniaAsiaAustraliaAustriaBahamasBangladeshBarbadosBelarusBelgiumBelizeBoliviaBosnia and HerzegovinaBrazilBulgariaBurma/MyanmarCabo VerdeCambodiaCameroonCanadaCaribbeanCentral AmericaChileChinaColombiaCongoCosta RicaCroatiaCubaCzechoslovakiaDenmarkDominicaDominican RepublicEastern AfricaEastern AsiaEastern EuropeEcuadorEgyptEl SalvadorEnglandEritreaEthiopiaEuropeFijiFranceGermanyGhanaGreeceGrenadaGuatemalaGuyanaHaitiHondurasHong KongHungaryIndiaIndonesiaIranIraqIrelandIsraelItalyJamaicaJapanJordanKazakhstanKenyaKoreaKuwaitLaosLatin AmericaLatviaLebanonLiberiaLithuaniaMalaysiaMexicoMicronesiaMiddle AfricaMoldovaMoroccoNepalNetherlandsNicaraguaNigeriaNorth AmericaNorth MacedoniaNorthern AfricaNorthern EuropeNorwayOceaniaPakistanPanamaPeruPhilippinesPolandPortugalRomaniaRussiaSaudi ArabiaScotlandSenegalSerbiaSierra LeoneSingaporeSomaliaSouth AfricaSouth AmericaSouth Central AsiaSouth Eastern AsiaSouthern EuropeSpainSri LankaSt. Vincent and the GrenadinesSudanSwedenSwitzerlandSyriaTaiwanThailandTrinidad and TobagoTurkeyUgandaUkraineUruguayUzbekistanVenezuelaVietnamWest IndiesWestern AfricaWestern AsiaWestern EuropeYemenZaireZimbabweAzores
Unemployment Among Ages 35 to 44 years
Income
Poverty
Unemployment
Labor Participation
Family Structure
Vehicle Availability
Education Level
Disability

Unemployment Among Ages 35 to 44 years Comparison

Haitians

New Zealanders

Tragic
Exceptional
5.5%
UNEMPLOYMENT AMONG AGES 35 TO 44 YEARS
0.0/ 100
METRIC RATING
284th/ 347
METRIC RANK
4.5%
UNEMPLOYMENT AMONG AGES 35 TO 44 YEARS
90.3/ 100
METRIC RATING
108th/ 347
METRIC RANK

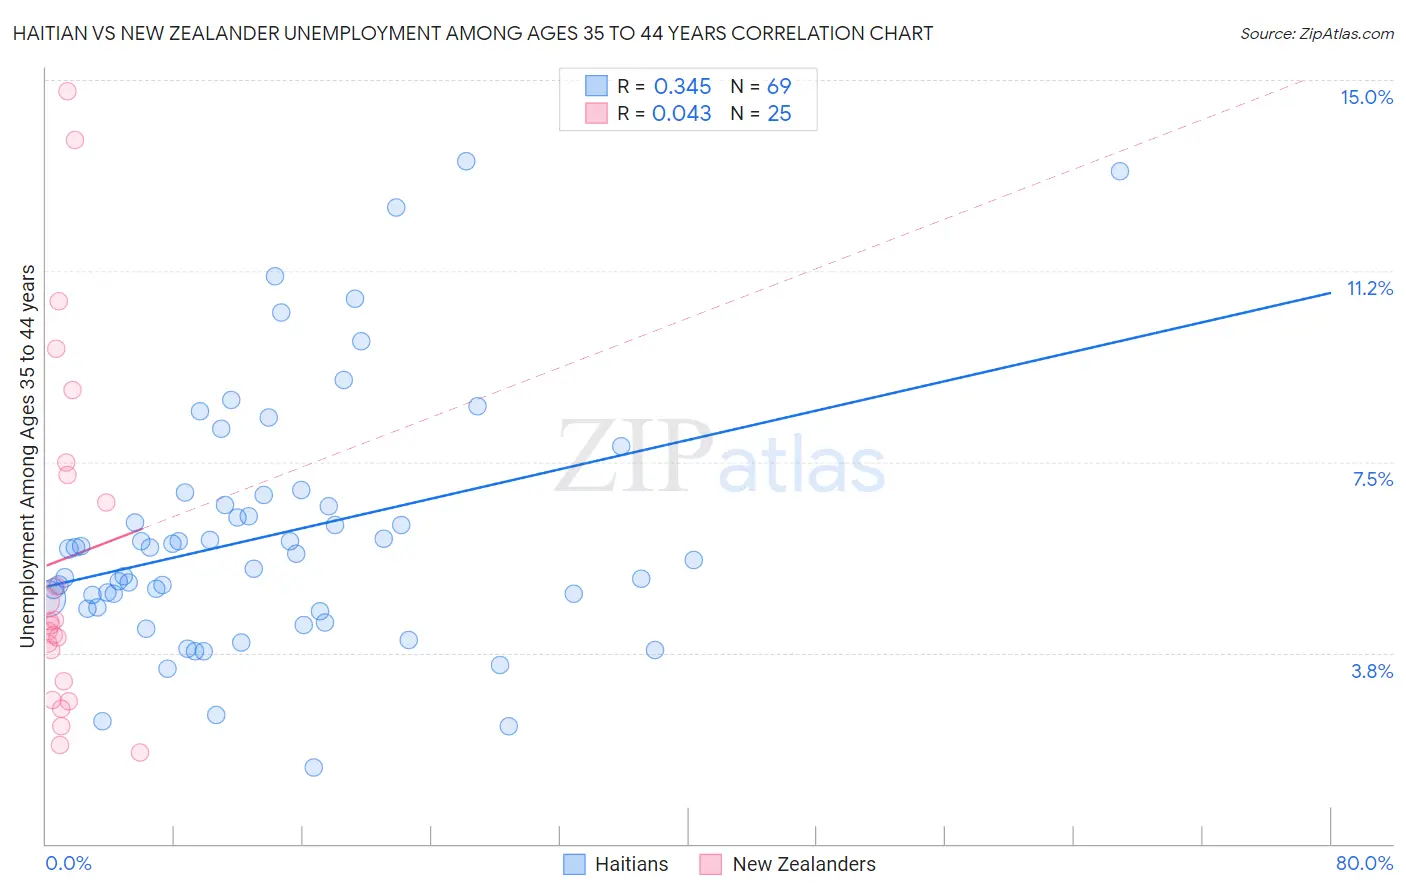
Haitian vs New Zealander Unemployment Among Ages 35 to 44 years Correlation Chart

The statistical analysis conducted on geographies consisting of 283,461,546 people shows a mild positive correlation between the proportion of Haitians and unemployment rate among population between the ages 35 and 44 in the United States with a correlation coefficient (R) of 0.345 and weighted average of 5.5%. Similarly, the statistical analysis conducted on geographies consisting of 106,194,191 people shows no correlation between the proportion of New Zealanders and unemployment rate among population between the ages 35 and 44 in the United States with a correlation coefficient (R) of 0.043 and weighted average of 4.5%, a difference of 21.6%.
Haitian vs New Zealander Unemployment Among Ages 35 to 44 years

Unemployment Among Ages 35 to 44 years Correlation Summary

MeasurementHaitianNew Zealander
Minimum1.5%1.8%
Maximum13.4%14.8%
Range11.9%13.0%
Mean6.1%5.6%
Median5.7%4.3%
Interquartile 25% (IQ1)4.6%3.0%
Interquartile 75% (IQ3)6.8%7.4%
Interquartile Range (IQR)2.1%4.4%
Standard Deviation (Sample)2.4%3.5%
Standard Deviation (Population)2.4%3.5%

Similar Demographics by Unemployment Among Ages 35 to 44 years

Demographics Similar to Haitians by Unemployment Among Ages 35 to 44 years

In terms of unemployment among ages 35 to 44 years, the demographic groups most similar to Haitians are Hispanic or Latino (5.5%, a difference of 0.16%), Immigrants from Micronesia (5.5%, a difference of 0.28%), French American Indian (5.5%, a difference of 0.40%), Immigrants from Ecuador (5.4%, a difference of 0.54%), and Cree (5.5%, a difference of 0.56%).
DemographicsRating | RankUnemployment Among Ages 35 to 44 years
Immigrants | Caribbean
0.0
/100
|
#277
Tragic
5.4%
Lumbee
0.0
/100
|
#278
Tragic
5.4%
Immigrants | Senegal
0.0
/100
|
#279
Tragic
5.4%
Ecuadorians
0.0
/100
|
#280
Tragic
5.4%
Immigrants | Portugal
0.0
/100
|
#281
Tragic
5.4%
Immigrants | Ghana
0.0
/100
|
#282
Tragic
5.4%
Immigrants | Ecuador
0.0
/100
|
#283
Tragic
5.4%
Haitians
0.0
/100
|
#284
Tragic
5.5%
Hispanics or Latinos
0.0
/100
|
#285
Tragic
5.5%
Immigrants | Micronesia
0.0
/100
|
#286
Tragic
5.5%
French American Indians
0.0
/100
|
#287
Tragic
5.5%
Cree
0.0
/100
|
#288
Tragic
5.5%
Spanish American Indians
0.0
/100
|
#289
Tragic
5.5%
Jamaicans
0.0
/100
|
#290
Tragic
5.5%
Dutch West Indians
0.0
/100
|
#291
Tragic
5.5%

Demographics Similar to New Zealanders by Unemployment Among Ages 35 to 44 years

In terms of unemployment among ages 35 to 44 years, the demographic groups most similar to New Zealanders are Romanian (4.5%, a difference of 0.0%), Immigrants from Kazakhstan (4.5%, a difference of 0.070%), Immigrants from North Macedonia (4.5%, a difference of 0.090%), Immigrants from Nicaragua (4.5%, a difference of 0.10%), and Immigrants from North America (4.5%, a difference of 0.18%).
DemographicsRating | RankUnemployment Among Ages 35 to 44 years
Immigrants | Netherlands
91.9
/100
|
#101
Exceptional
4.5%
Immigrants | Sudan
91.8
/100
|
#102
Exceptional
4.5%
Welsh
91.6
/100
|
#103
Exceptional
4.5%
Finns
91.6
/100
|
#104
Exceptional
4.5%
Immigrants | Saudi Arabia
91.3
/100
|
#105
Exceptional
4.5%
Immigrants | North America
91.1
/100
|
#106
Exceptional
4.5%
Immigrants | North Macedonia
90.7
/100
|
#107
Exceptional
4.5%
New Zealanders
90.3
/100
|
#108
Exceptional
4.5%
Romanians
90.3
/100
|
#109
Exceptional
4.5%
Immigrants | Kazakhstan
90.0
/100
|
#110
Excellent
4.5%
Immigrants | Nicaragua
89.8
/100
|
#111
Excellent
4.5%
Immigrants | Czechoslovakia
89.2
/100
|
#112
Excellent
4.5%
Immigrants | Italy
88.4
/100
|
#113
Excellent
4.5%
Macedonians
88.3
/100
|
#114
Excellent
4.5%
Maltese
88.1
/100
|
#115
Excellent
4.5%